Get in touch with Kitech Company
Ocean recycling refers to collecting plastic before it enters the ocean (by intercepting it on the coast, placing barriers in the rivers, or removing plastics from the ocean with clean-up operations) and transforming it into re-usable pellets at a pelletizer – via a shredding, washing, drying, and pelletizing process. Much of what companies sell as “ocean plastic” is in fact ocean bound: the kind of plastic that is collected from the coast within 50 kilometres of the coast-line (or about ³1 miles), and doesn’t have a formal waste management system in place. It is important to understand the distinction here, because this is what your supply chain can and cannot provide—along with in what grade.
Quick Specs: Ocean Recycling at a Glance
| Annual ocean leakage (UNEP, 2025) | 19–2³ million tonnes/yr |
| Global plastic recycling rate | ~9–10% (OECD) |
| Coastal-source share of marine litter | ~80% (OBP definition) |
| Ocean Cleanup 2025 collection | ~25 million kg removed |
| Recycling stages (sea → pellet) | 4 (shred → wash → dry → pelletize) |
| Typical recycled pellet pricing | PET flakes $0.30–0.60/lb · HDPE $0.40–0.70/lb |
What Is Ocean Recycling?
Ocean recycling is a shared term for two related things: (1) the collection of plastic that has already entered the ocean, on rivers or along coastlines, and (2) the industrial recycling that converts recovered plastic into granules for use in manufacturing. The vast majority of the “ocean plastic” currently being used in consumer applications is actually an example of something even more accurately termed ocean-bound plastic (OBP) a stream of plastic pollution that is at risk of entering the marine environment, and has been intercepted before it makes it there, although real ocean-recovered plastic—collected from the open ocean using methods such as The Ocean Cleanup’s offshore plastic collection arrays—does occur, but in tiny quantities relative to the OBP stream.
Both routes lead to the same end process. Post collection it will need separating from contaminants such as salt, sand and biofouling, washing, drying and pelleting (this is the same process as normal post consumption reprocessing but with a focus on removing contaminants and accepting a lower grade output relative to virgin and land sourced recycled resin).
How Much Plastic Actually Reaches the Ocean — and Where It Comes From

You will notice “8 million tons”, “11 million tonnes” and “14 million tons”are well banded across articles on ocean plastic – and they are sometimes banded within the same article. None of them is in argument, exactly. But they are different scales from different years.
Latest authoritative studies have put the annual leakage at 19 – 23 million tonnes, the picture shifts according to whether you include rivers, lakes and margins or just open ocean.
| Source (year) | Figure | Scope |
|---|---|---|
| UNEP (2025) | 19–23 Mt/yr | Aquatic ecosystems (lakes, rivers, seas) |
| IUCN (2024) | 20 Mt/yr | All natural environments |
| Pew Charitable Trusts (2025) | 130 Mt/yr | Total environmental release (broadest scope) |
| OECD (2025) | 76 Mt accumulated by 2040 | Cumulative ocean accumulation projection |
Figures vary because different sources quantify different things. UNEP estimates capture all aquatic environments. IUCN considers plastics in any natural environment.
Pew considers 130 Mt of plastics deposited onto land, air and water combined. OECD considers only estimates for accumulation in the ocean. For just about all B2B sourcing decisions, base decisions on UNEP 19-23 Mt range, because that measures the plastics being deposited from controlled waste streams into aquatic environments, ie., where your suppliers can intercept the plastics.
📐 Engineering Note: Where the Plastic Actually Comes From
The most common source pathway of plastic to the oceans is land-based sources. While there is the well known Great Pacific Gyre and other floating plastic bodies of gyre accumulations are also renowned, the majority of the input is land sources. Ocean Bound Plastic certification – managed by the Zero Plastic Oceans and audited by Control Union – defines OBP as plastic generated by populations within around 50km of a coast, that are without established formal waste management system, and approximates generation of 80% of conventional plastic marine debris.
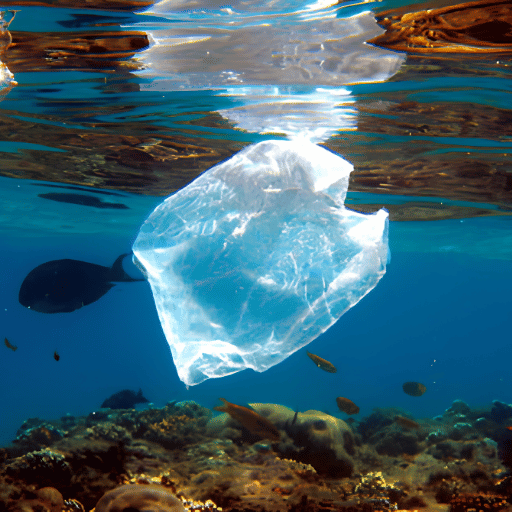
Most ‘ocean plastic’ was not in fact floating in the open ocean; it washed off a beach, or was discharged into a river.
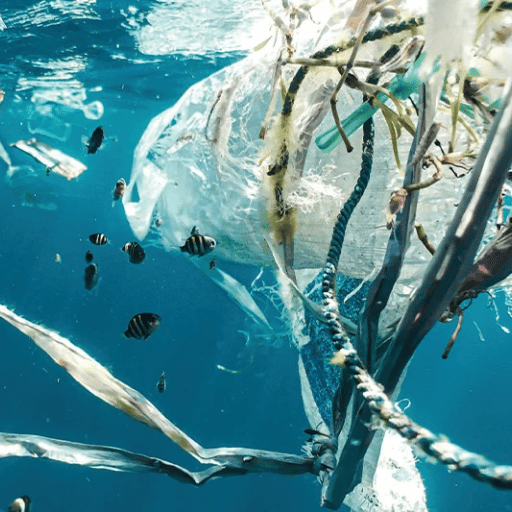
Although the plastic in the gyres is real, it is just the trade-off for a much larger flow from land. Marine species suffer either way: they are killed through ingesting or being entangled, and the plastic particles resulting from the breakdown of debris by wind and waves are now present in food chains and drinking water. If nothing is done, there could be 76 million tonnes of plastics in the ocean, forecast by the OECD to grow to 141Mt by 2060.
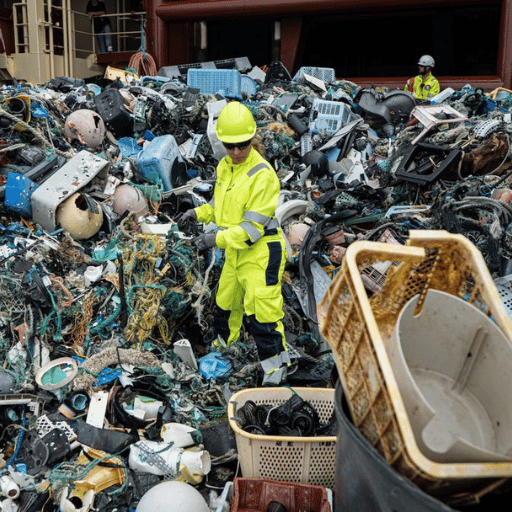
Sea-to-Land: How Ocean Plastic Is Actually Collected

There are three clusters in which collection methods group, each appropriate to an area of the plastic cycle as discussed above from human use through to the open ocean. The volumes they operate at are separated by orders of magnitude, and the type of contamination of the plastic recovered also differs.
| Collection Method | Where It Operates | Typical Throughput | Contamination Level |
|---|---|---|---|
| Coastal collection (OBP) | ≤50 km from shoreline | Highest volume — millions of tonnes/yr aggregated globally | Moderate (sand, organic) |
| River barriers (Interceptor) | River mouths, before plastic enters sea | Hundreds of tonnes/yr per unit | Moderate-high (silt, vegetation) |
| Offshore cleanup (System 03) | Open ocean (Pacific gyre) | ~25 million kg/yr (2025) at fleet scale | Severe (UV-degraded, biofouled, salt-saturated) |
How Does Plastic End Up in Rivers?
Rivers serve as conveyor belts conveying land-born plastics to the oceans. In urban areas on the coast, and even within inland watersheds where there is no curb side collection, plastic tipped into streets, drainage ditches and open dumps on land enters the drains and carried by the flow of storm water runoff to inland and coastal waters and enters the rivers. From there, ocean currents eventually carry the plastics to basin openings and finally to the open ocean.
Ocean Cleanup’s Interceptor program addresses this stage – deploying solar-powered floating barriers to the most plastic-polluted rivers and capturing waste water before it reaches the water’s edge.
A April 2025 The Ocean Cleanup news release measured a total of 25 million kilograms of plastic cleared from our oceans and rivers in 2025, more than twice the 11.5 million kg in 2024, and the first time cumulative output crossed the 50 million kg mark. That level of annual capture is barely 0.5% of a single year of ocean leakage—relatively encouraging news of course, but an unmistakably clear indication that interception alone won’t do enough.
In order to eliminate plastic from the ocean, it is necessary to action two key steps: removal of the accumulated legacy pollution and prevention of the entering of new plastic through rivers.
— Boyan Slat, Founder & CEO, The Ocean Cleanup
💡 The 50-km Coast Rule
In order to meet the “ocean-bound” premise, any recovered plastic must come from the vicinity of a coastline that does not have a sufficient waste-management system – 50km or less. Buyers of a genuine “ocean-recovered” good – taken from open water – face a more delicate query to ask their supplier: has this plastic already been in the ocean, or was it intercepted en route?
That distinction matters, and in virtually all cases will mean entirely different quantities, prices and grades of material.
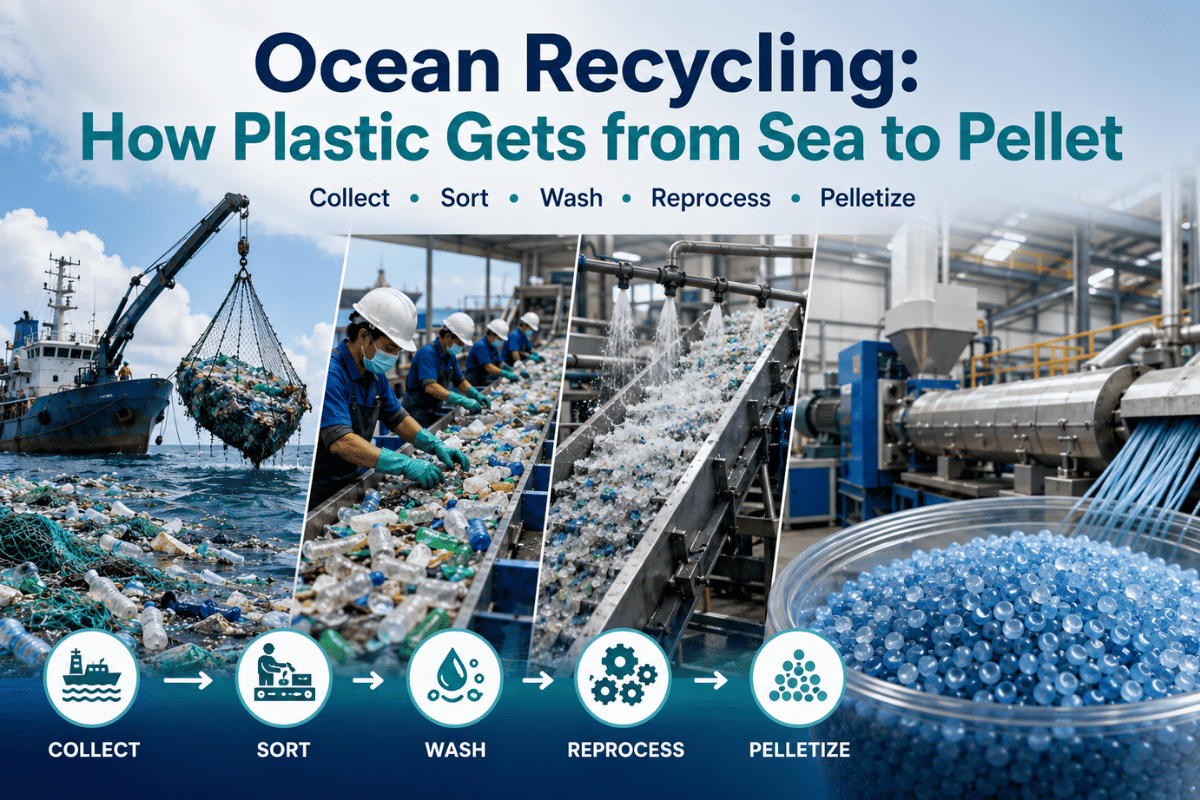
Sea-to-Pellet: The 4-Stage Recycling Process

All Ocean and Ocean Bound Plastic, upon collection, is directed into a four stage recycling line similar to that used for standard post consumer recycling, but with added waste and materials degradation issues to contend with. Here’s the flow chart, used by turnkey recycling plants across the globe. Saltwater, sand, biofouling, and UV damage all add to the engineering problem, but the categories of machinery involved are familiar.
Stage 1 — Sorting and Shredding
Mixed incoming plastics: recovered plastic is contaminated with sand, organic film, multi-resin items, and metal inclusions. Manual or automated separation by resin type (mainly PET, HDPE, PE film, or PP) leads to washed streams that are sorted before feeding a shearing stage: an industrial plastic shredder fitted with high carbon D2 or SKD-11 blades shreds to a homogeneous 10-50 m size. Shredder power draw depends on complexity of feed stock; light film 15 kW, heavy-walled HDPE drums, rigid ABS shells carry 200 kW. Making uniform flakes at this stage is a hard requirement for the aggressive washing downstream.
Stage 2 — Washing and Contaminant Removal
This is the stage at which ocean plastic most visibly departs from clean post-industrial scrap. A hot caustic wash at 60-85 C dissolves hitherto-soap incompatible adhesives and organic resins. Friction washers operating at 900-1,200 rotations per minute mechanically strip salt, organic film, and adhered dirt. Specific to PET, a float sink tank separates bi-resin streams that are otherwise indistinguishable; PET flakes (SG>1.0 g/cm) sink, while floating PE/PP bottle caps and label fragments are separated out. For PE film resin, an additional squeeze-press step mechanically densifies the lightweight material, removing entrained water and enabled by the low-application-temperature starting stock. oceanic feedstock plastic washing modules at the heart of traditional ocean plastics reclamation systems employ multi-stage processes: hot wash caustic, friction rinse, hot wash, float sink, squeeze, cold rinse, centrifuge, dewatering.
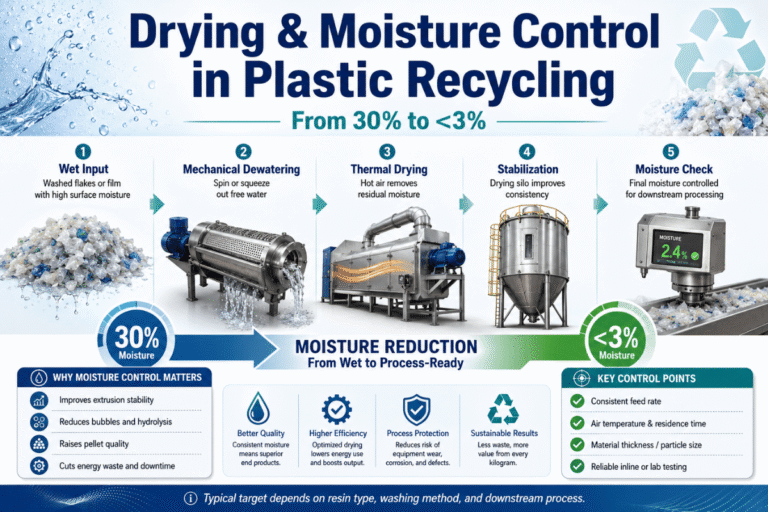
Stage 3 — Drying and Moisture Control
After washing, flakes may be as high as 40% moisture. Even minimal residual moisture content on plastics at this point impairs the downstream extruder’s ability to VENT a vacuum with the air and humidity that trigger inconsistent pellet outturns. Centrifugal dryers and screw-press dewatering machines may be used to drop residual moisture content below 3% (a level at which industrial extruders are not driving meeping bubbles through molten plastic). For PE film recycling lines, an extra squeeze-press step entrains any residual water pockets before the drying stage. Investing in the downstream pelletization equipment can be a waste of capital if you don’t get the plastics washing step right.
Stage 4 — Pelletizing and Quality Control
Single- or two-stage extrusion systems fitted with 80-120 mesh melt filter screens produce cleaned-up material (up to 3% residual moisture) for pelletization. Three pelletizer geometries exist to suit different specifications: strand die extruders for bulk weighed batches, water ring die extruders for round pellets at high throughput, and die face die extruders for ultra-high throughput of the densest, hardest plastic. Final pellet density, color, melt flow index are set in the final pelletizer stage. TO be fit into a PET specific recycling line, the applicable PET specific hot wash line is used; flexible lines are fed through a PE film specific hot wash line.
📐 Engineering Note: PET vs PE/PP Separation
In a PET (SG 1.34-1.39gcm) line, the ability to use a float sink tank downstream of grinding separates PET into two streams with distinct densities (1.18 and 0.97 g/cm). PET origin stream can be diverted, and two-PET streams fed into a single pelletizer for blending. In a PE line, the float sink tank is eliminated and hot wash, friction rinse, and squeeze-presses are used to densify the flake. Mixing these process lines or omitting hot-wash degrades final quality in both directions.
⚠️ Common Misconception
“Ocean plastic” feedstock that reaches a recycling plant is not usually retrieved from the open ocean. Most, indeed, comes from coastal collection schemes, river interceptors and beach cleans, and this is the fingerprint of the contamination. Like-wise, plastic recovered from the open ocean has been in contact with the salt water for months and years, and the direct sunlight has imparted a weathered aging process, with broken polymer chains and less mechanical strength.
Processes are scaled to cope with the reality of the general excess, not the glamorous minority.
This same 4-step workflow (shred, wash, dry, pelletize) becomes the backbone upon which processing changes when the input is blanketed ocean-bound PET bottles or post-industrial scrap. What scales up for ocean feedstock is the washing strength and tolerance for various material grades.
From Flake to Pellet: End-Product Quality Grades

Not all recycled ocean pellets are converted into used for production of a sneaker upper or sunglass frame. That final grade is based on input contamination levels and the level of damage the polymer incurred from saltwater/UV weathering during collection/processing. Studies published in Marine Frontiers in Marine Science (2025) and Iñiguez et al. (2018) have demonstrated that UV exposure in seawater reduces the thermal and mechanical properties of ten out eleven common plastics significant enough to normally grade the ocean-recovered output at one lower grade than land-sourced recycled options.
✔ Advantages of Mechanical Recycling
- Lower energy use than chemical recycling or virgin production
- Pre-established equipment supply chain ( ready supported with CE/UL/ CSA certified turnkey lines)
- Pellets ready for Injection Molding, Fiber Extrusion or Non-Food Packaging.
- Clear ASTM/EN process compliance pathways
⚠ Limitations to Plan For
- UV-degraded polymer = reduced impact strength vs virgin
- Color contamination – consistent clear or food grade output is almost never achieved
- Salt residues need extra washing capacity vs land scrap
- Food-contact certification is difficult for marine-sourced material
| Grade | Typical Use | Indicative Price (2025-2026) |
|---|---|---|
| Food-contact rPET (rare for marine source) | Beverage bottles, food packaging | Premium tier above $0.60/lb |
| Fiber-grade rPET (most common output) | Polyester yarn, textile, non-woven | $0.30–0.60/lb (PET flakes) |
| Mechanical-grade rHDPE | Pipe, crates, outdoor furniture, decking | $0.40–0.70/lb (HDPE pellets) |
| Mixed PE film grade | Bin liners, low-spec extrusion, industrial bags | Variable — depends on contamination |
⚠️ Don’t Confuse Pellets with Nurdles
A “nurdle” is a pre-production plastic pellet—virgin resin that is manufactured by petrochemical companies and freighted by the tonne to plastic converters. Nurdles on beaches are not recycled output, but spillage from container ships, train derailments, and pellet-handling sites on the supply chain. Recycled ocean pellets are made through the four-stage process described above.
Visual similarity between virgin nurdles and recycled pellets is one factor that makes shoreline pellet pollution so hard for the public to understand.
For further information on how different plastics compare in terms of recyclability, please see our guide to types of plastics and PET recycling complete guide.
Ocean Bound Plastic (OBP): What the Certification Actually Means
The most common certification standard that many consumer brands now use when labeling a product as an answer to ocean plastic pollution is ‘Ocean Bound Plastic’. Before sourcing or specifying ‘what it does and doesn’t’ promise, we need to understand:
What Is “100% Ocean Bound Plastic”?
As per the definition consistent across Zero Plastic Oceans’ accountings and validated by Control Union, OBP is project upstream plastic as ocean-intrinsic waste or uncollected waste. That is plastic polluting shores, collected from people living within 50km of coastline without solid waste collection. As per the certifier this represents nearly 80% of marine litter, hence interception is where the numbers can begin to be truly processed
100% Ocean Bound Plastic means the certified fraction of a finished product was sourced from an area under a defined infrastructure boundary, traced via audited chain-of-custody, and confirmed in batch documentation. It does not mean the plastic was fished out of the open ocean. Brands touting nondistinctive “ocean plastic” claims that lack mention of OBP certification and Control Union audit number are peddling messaging without verifiable substance.
OBP Certification Decision Tree
- Need third-party audited claim for retail packaging? OBP Certification (Zero Plastic Oceans + Control Union audit number)
- Want social-impact narrative tied to coastal collection workers? Plastic Bank “Social Plastic” supply (separate certification stream)
- Need genuine open-ocean recovered material (not OBP)? Limited supply via The Ocean Cleanup partner brands; expect premium pricing and small batch sizes
- Brand-side self-declaration only? Highest legal risk; subject to FTC/EU Green Claims Directive scrutiny
⚠️ Greenwashing Watch
Industry observers note that “recycled ocean plastic” branding can mask continued virgin plastic production at the parent product level – a single OBP-certified bottle does not change the broader material balance. When auditing supplier claims, ask for: (1) the OBP certification number, (2) the Control Union audit date, (3) the chain-of-custody documentation linking your specific batch to a certified collection site, and (4) the percentage of OBP content in the finished product.
Who’s Actually Doing the Recycling Work

Four functionally different player categories make up the ocean plastic landscape. Confusing them is the most common reason brand procurement teams over-promise on packaging claims.
| Player | Role | What They Verify |
|---|---|---|
| The Ocean Cleanup | Direct collector — gyre + river | Cumulative tonnage removed (50M+ kg) |
| Plastic Bank | Coastal aggregator + Social Plastic certification | Collector compensation + chain-of-custody |
| Oceanworks | B2B marketplace for OBP and recycled feedstock | Supplier vetting and material specifications |
| Brand-side users (Adidas, Norwex, etc.) | End buyers / product converters | Their supplier’s certification + finished-product claims |
Has The Ocean Cleanup Been Successful?
By absolute tonnage, yes – and the trajectory is steepening. Their 2024 update reported 11.5 million kg of trash removed from oceans and rivers, surpassing all previous years combined. By 2025, that figure climbed to roughly 25 million kg, taking cumulative recovery past 50 million kg. By the engineering metric the project set for itself – building scalable hardware that removes plastic from the ocean and rivers – the answer is positive.
By the broader question of solving ocean plastic, the picture is more complicated. Annual recovery still represents a tiny fraction of new plastic entering aquatic systems each year. The project’s leadership has been consistent about this: collection alone cannot close the gap. Source-side intervention – through OBP-style coastal collection, river interceptors, regulatory action, and reduced plastic production – is needed to bend the curve. For a deeper technical comparison of recycling pathways including chemical methods, see our analysis of mechanical vs chemical plastic recycling.
“Recycling ocean plastic is meaningful only when it is paired with reductions in virgin plastic production. Otherwise the system rewards collection without changing what flows in.”
— Synthesis of remarks from Pew Charitable Trusts and Ocean Conservancy researchers, 2024-2025
How Manufacturers Source Recycled Ocean Plastic
For procurement teams sourcing recycled ocean or ocean-bound feedstock, the right channel depends on order volume and certification requirements. Below, a decision tree maps three realistic paths.
Sourcing Decision Path by Volume
- Less than 1 tonne (sample or pilot): Purchase through a B2B marketplace such as Oceanworks. Expect higher per-unit price but flexible specs and small lots.
- 1-50 tonnes (production trial / SKU launch): Source via an OBP-certified processor, with a Control Union audit number. Lead times are running 4-8 weeks for specification and consistency to supply to Plastic Bank or equivalent.
- 50+ tonnes (ongoing supply / multi-product line):Coastal collection program partner also contracted recycling line. For volumes at this magnitude, building or contracting a new line (or using custom configuration of a broker line) will deliver on-spec pellet quality vs. broker pricing within 18-36 months of starting.
If your business case defaults to option 3, the advantage of running your own line is complete control of pellet quality and traceability (instead of relying on broker). Use the Kitech plastic recycling line selector to match your input stream and output capacity and the plastic recycling plant cost guide 2026 for indicative budget ranges.
Industry Outlook 2026–2030: Where Ocean Recycling Is Headed
Three major trends are set to influence ocean recycling over the next five years; rising demand for voluntary certification, an uncertain oceans treaty process, and increasing operational scale at the big five collectors.
The number of searches for ‘ocean bound plastic’ (OBP) was 38% higher year-over-year as the calendar changed to 2026. ‘Pet bottle recycling’ also grew 11% YOY, indicating that procurement teams across brands will set contracts early, so as not to fall behind on bottlenecked certified processor capacity when multiple brands negotiate contract lead times simultaneously.
The interim international plastics treaty remains in negotiation, not yet ratified or binding, with talks splintering into two sessions between Busan (inc. INC-5.1 scheduled for Nov-Dec 2024) and Geneva (INC-5.2 in August 2025). After the chair resigned in August 2025, INC-5.3 was called with a new set of leaders, and negotiations remain unsettled. Practical consequence: voluntary standards like OBP and Plastic Bank will meet the plastic recycling gap, regardless of time, until something binding is ratified. Buying decisions based on the treaty being ‘imminent’ risk making an unattractive pivot to ‘voluntary is the only game in town’ come 2028.
Scale is still doubling at the big five collection operators, with Ocean Cleanup’s total yearly tonnage jumping from 11.5 million kg in 2024 to roughly 25 million kg in 2025. River interceptor assets are going into more watersheds, and coastal collection stations are onboarding more workers. Still, OECD research projects ocean plastics volume totaling 76 million tonnes in 2040 and 141 million tonnes in 2060, meaning that collection is not yet keeping up with load-in.
For brands and converters, the commercial insight is: Plan for OBP-certified supply contracts to come in 2026 and 2027, maximize visibility within your own operation before treaty rules banish it, and imagine voluntary certification is how verification will work through at least 2027. For additional context on the closed-loop transformation, see our piece on the circular economy for plastic.
Frequently Asked Questions
Q: How does ocean recycling actually work?
View Answer
Ocean and ocean-bound plastic is melted down after sorting from sediment from coastlines and rivers, or collected directly from the open water, separated by resin, and reprocessed in four ways: suspended in a generator and (shredded to 10-50 mm flakes), washed in hot caustic and with friction, dried to less than 3% moisture, then pelletised in a melt filter. The resulting pellets reenter manufacturing, typically for textile fibre, bagging or non-load-bearing part production, due to the lower mechanical strength attained by way of a UV-damaged plastic in water.
Q: Why is ocean recycling important?
View Answer
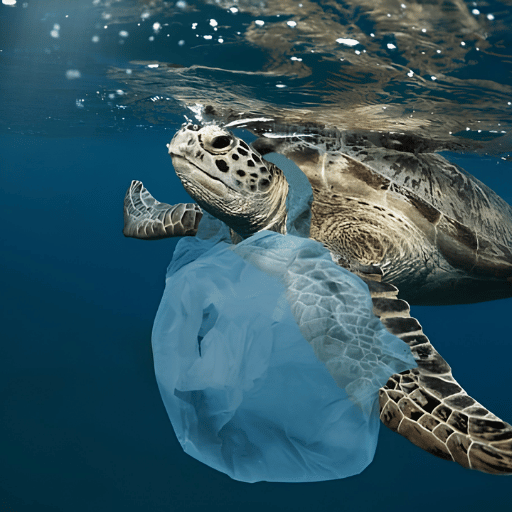
Reduces bulk of plastic flowing into marine environment where it kills turtles, sea-birds, whales and coral reefs, and reintroduces usable resin to be fed back into the materials system- lowering demand for virgin plastic at the margin. Spends a signal to producers that a closed-loop system is being developed.
Q: Why is pyrolysis not widely used for ocean plastic?
View Answer
Pyrolysis (a chemical recycling pathway) returns plastics to hydrocarbon feedstocks rather than melting plastics into pellets. Sadly, pyrolysis has high capital costs (3-5 times higher than mechanical lines), requires high energy input, yields (due to variations in feedstock) are inconsistent, and most pyrolysis output is turned back into fuel rather than new plastic. For most ocean and ocean-bound feedstock the economics still favor mechanical recycling, with chemical methods reserved for feeds too contaminated or chemically resistant to be mechanically recycled.
Q: How do microplastics affect marine life and human health?
View Answer
Microplastics (less than 5 mm diameter) are ingested by higher marine life, and into which they bio-accumulate. Marine pollution has been recorded to affect many marine creatures, (including sea turtles, seabirds, fish) and the proteins, blood and milk of humans. Long-term effects are not yet fully understood, but it is known that ingestion is common and that microplastic load increases as macro plastics degrade under UV light.
Q: Is “ocean bound plastic” the same as plastic recovered from the ocean?
View Answer
5. No. Open-ocean-recovered plastic is a statistically much smaller volume, generally of a much lower grade owing to UV degradation, and is not commercially available at scale.
Ocean Bound Plastic is collected within approximately 50 km of coastlines.
Q: Can recycled ocean plastic be used for food-grade packaging?
View Answer
Very rarely and only in very tightly regulated chain-of-custody situations. Food-contact rPET demands rigorous feedstock traceability, which is unreliable for marine-derived input; the FDA and EFSA Letter of Non-Objection processes tend to target closed loop bottle-to-bottle PCR streams. The majority of recycled ocean and ocean-bound plastic is directed to fiber, non-food-packaging, outdoor-furniture, decking, etc. applications that can handle the contamination history.
Designing or scaling up your ocean bound or post-consumer plastic recycling line?
Kitech engineers turn-key systems tailored to your input stream and certification requirements.
About This Analysis
This sea-to-pellet process explainer was commissioned by the Kitech engineering team on primary data from over 500 plastic recycling line installations (spanning 80+ nations) using first production specifications aligning and. against UNEP, IUCN, OECD, and independent marine science journal reviewed data from 2024-2025. And pellet prices are shown by industry standard (at Q1 2026); ask for a quotation with your specific configuration as feedstock sources, local power standards, and desired pellet specs all significantly affect, the line cost.
References & Sources
- Plastic Pollution — United Nations Environment Programme
- Plastic Pollution Issues Brief — International Union for Conservation of Nature
- Breaking the Plastic Wave 2025 — The Pew Charitable Trusts
- Stemming Plastic Pollution to Protect the Ocean — Organisation for Economic Co-operation and Development
- What Is Ocean Bound Plastic? — Zero Plastic Oceans (OBP standard owner)
- OBP Ocean Bound Plastic Certification — Control Union Global
- Updates Page (cumulative recovery milestones) — The Ocean Cleanup
- Intergovernmental Negotiating Committee on Plastic Pollution — United Nations Environment Programme
- INC-5.3 Concludes with Election of New Plastics Treaty Negotiation Chair — Center for International Environmental Law
- Mechanical recycling and upcycling of marine macro- and microplastics — Frontiers in Marine Science (Teng et al., 2025)
- Recyclability of four types of plastics exposed to UV irradiation in seawater — Iñiguez et al., Waste Management (2018)
Related Articles
- Plastic Pollution in the Ocean — full pollution overview
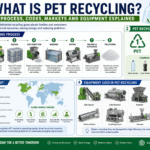
- PET Recycling Complete Guide — deeper PET process detail
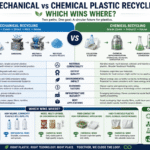
- Mechanical vs Chemical Plastic Recycling — process pathway comparison
- Circular Economy for Plastic — closed-loop transition
- Plastic Recycling Machine: Types, Selection & Cost
- Plastic Recycling Plant Cost Guide 2026