Get in touch with Kitech Company
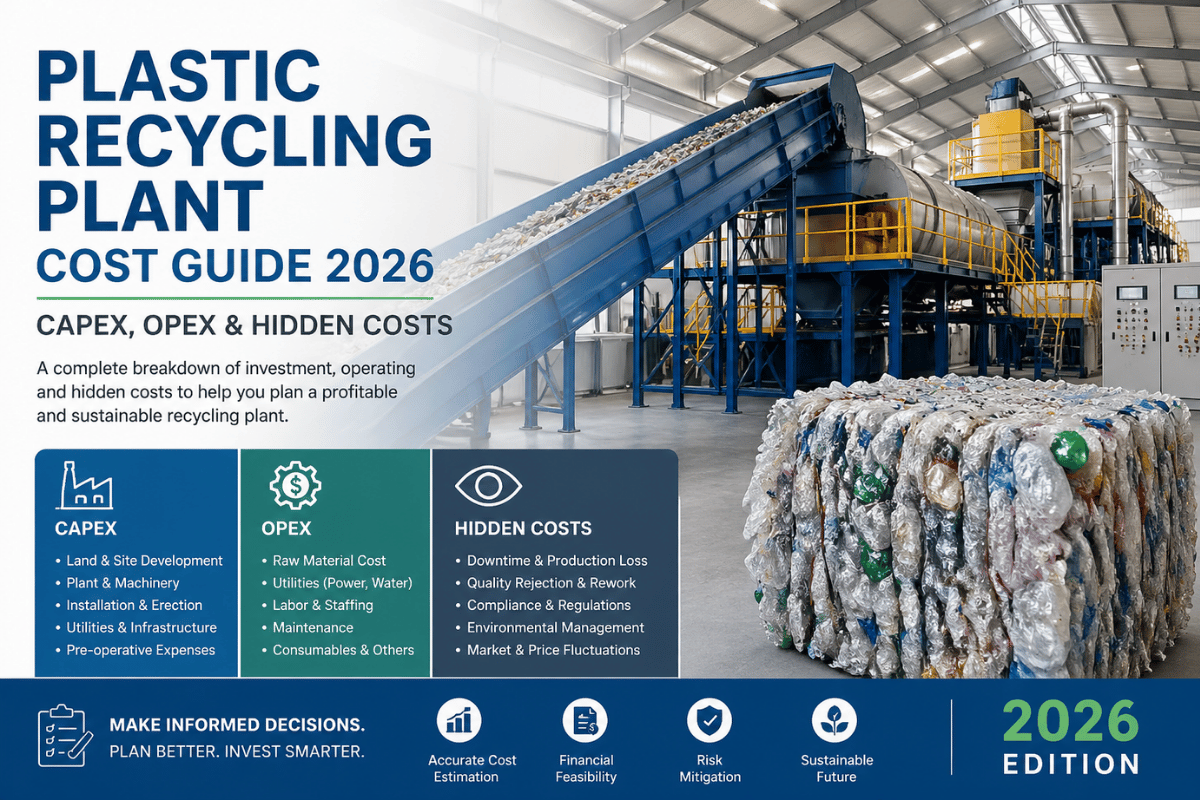
A plastic recycling plant cost guide 2026 has to do more than stand machine prices. Total project budgets range from $150,000 for a small 100-300kg/h pilot line to $2,000,000+ for a full automated 3,000kg/h line and equipment makes up just 40-50 percent of that. Civil works, electrical upgrade, wastewater compliance, three months of working capital, and more discreetly represent another 50-60 percent.
The figures below are derived from entire plastic recycling lines implementation in over 80 countries cross checked with EU JRC, EPA, OECD, IEA and Pew Charitable Trusts data so you plan on reality and not vendor wishful thinking.
Quick Specs — Plastic Recycling Plant Cost 2026
| Capacity range | 100 – 3,000 kg/h |
| Total CAPEX (turnkey) | $150,000 – $2,000,000+ |
| Machinery share of total | 40 – 50% |
| Hidden expenses share | 40 – 50% on top of equipment |
| OPEX (mid-size, monthly) | $15,000 – $45,000 + feedstock |
| Avg electricity intensity | 61.1 kWh per ton recycled (EU JRC) |
| Payback period | 18 – 36 months (conservative) |
| Mechanical recycling yield | 65 – 80% of input mass (EEA/JRC) |
| Certifications required | CE 2006/42/EC, UL 746S, CSA C22.2 |
Cost at a Glance — Total Investment by Plant Scale
Most buyers want one number. There isn’t one number – but a closed set of possibilities easy to interpret in less than a minute. The graph below illustrates three different plant scales plotted against each of three material clusters … because total CAPEX is a function of both: a 1,500 kg/h PET washing line isn’t the same financial proposition as a 1,500 kg/h film recycling system, and budgeting for the latter as if it’s the former is how first time investors fall short of their targets by 30%.
| Plant Scale | PET Bottle Line | HDPE / PP / Rigid | PE / LDPE Film |
|---|---|---|---|
| Small 100 – 300 kg/h | $200,000 – $450,000 | $150,000 – $350,000 | $180,000 – $400,000 |
| Mid 500 – 1,500 kg/h | $450,000 – $1,000,000 | $300,000 – $700,000 | $400,000 – $850,000 |
| Large 1,500 – 3,000 kg/h | $1,000,000 – $2,200,000+ | $700,000 – $1,500,000 | $850,000 – $1,800,000 |
Total project cost (turnkey, equipment + facility retrofit + electrical/water + permits +3month working capital). Source: kitech installation data 2024-2026 across 80+ countries; cross-checked with industry pricing benchmarks. Capacity rates (kg/h) designate input throughput—sellable recyclate output is approximately 65-80% of input mass after sorting, washing rejects and residue losses according to European Environment Agency / JRC analysis.
Does not include feedstock stock beyond 3months; land purchase.
This matrix suggests three rules. PET lines are 30-40% higher CAPEX than against a similar throughput HDPE or rigid line because PET hot caustic washing at 60-85 C will use stainless steel plus heaters. Film lines are intermediate because the additional dewatering and densification steps incur another 10-20% over rigid lines.
And the limit of small-to-mid jump (3 to 5 times throughput) only doubles the total CAPEX, because facility, permits and working capital scales far less than equipment
💡 Pro Tip
Begin at the scale your confirmed feedstock supply will support – not the scale you aspire to. Oversized plant equipment that runs and runs was paid for in capital, it does not generate cash flow by making money. Most of the failed projects we visited had been sized for a future feedstock pipeline that had not been developed.
Use our interactive line selector tool to build a size based on your material profile.
CAPEX Breakdown — Where Does Your Capital Go?

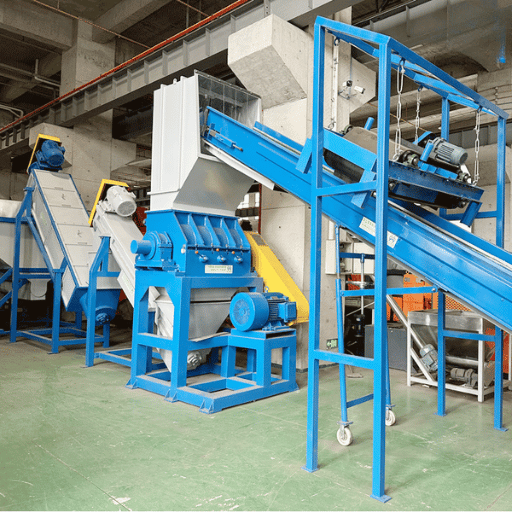
The four plastic recycling machine families under this equipment line item (shredders, washing systems, pelletizers, auxiliaries) account for about 90% of that spend. Because each of the different family products varies inversely with automation and throughput, only knowing the spread by capacity tier will tell you a fair quote. The prices below are FOB – an installation premium of 8-15% is added.
| Equipment | 300 kg/h | 1,000 kg/h | 2,500 kg/h |
|---|---|---|---|
| Industrial plastic shredder | $3,000 – $25,000 | $25,000 – $60,000 | $60,000 – $100,000+ |
| Plastic washing system | $50,000 – $120,000 | $120,000 – $300,000 | $300,000 – $600,000 |
| Plastic pelletizing system | $30,000 – $80,000 | $80,000 – $150,000 | $150,000 – $250,000+ |
| Auxiliary (conveyors, sensors) | $8,000 – $20,000 | $20,000 – $50,000 | $50,000 – $100,000 |
Automation is the next largest factor. A semi-automated PLC line costs 15-22% above a manual line for similar throughput. Further automation with PLC + SCADA + automated feeding + sensor-based monitoring, adds 25-35%. AI-assisted optical sorting adds $50,000-$200,000 to your resin mix depending on shade variations. For further individual line machine economics, see our pack of images describing plastic pelletizing machine costs – pelletizers and their melt-filter chains are the single most expensive part of most lines, particularly with more efficient continuous (non-stop) screen changers.
What Is the Most Expensive Component in a Plastic Recycling System?
The pelletizing block – extruder + melt filter + die-face cutter – is the single most expensive part of 80% of the lines we deliver. Two-screw pelletizer with continuous (dual-station) melt filtration goes $80,000 to $250,000 based on throughput, with the filtration module alone accounting for $8,000-$25,000. This is primarily two reasons: the pelletizer accounts for the topsides of chemical engineering thermodynamics, exact pressure moderation, and a precision tolerances for polymer control; the continuous filter eliminates the production stops that can wreck uptime in more traditional slide-plate designs. For those producing food grade rPET or fiber grade pellets, the pelletizer can claim 40-50% of total costs. For those making only flakes (no extrusion), the first place holder is the hot caustic washing system–also driven by stainless steel construction and heating elements.
📐 Engineering Note
A 500 kg/h washing-and-pelletizing line consumes 200-400 kW of installed electric motors. At an industrial tariff of $0.10/kWh, operating 16 hours/day x 22 days/month, thats around $7,000-$14,000 in monthly electrical expenses alone. EPA’s 2024 Financial Estimates to Modernize Material Recovery Infrastructure provide a useful regulatory proxy, benchmark CAPEX upgrades for American material recovery centers, when underwriting private investors with grant or EPR money.
When examining a quote, look for listing of individual motor brands and power ratings, blade steel quality (D2 or SKD-11 are the most resilient), screen mesh densities, and unambiguous scope of supply including installation, commissioning, and operator training. A bid that combines everything into one lump sum is hiding 12-20% of cost categories that will surface during commissioning.
OPEX — What It Really Costs to Run the Plant Every Month

Operational recycling decisions determine whether the CAPEX ever pays back. Most cost guides stop at “electricity and labor are the big variables” – not helpful. The following table breaks down a typical (500 kg/h, 16 hr/d, 22 day/mo, ~176 ton output) mid-scale plant into six quantifiable line items, each with a unit expense driver which can be cross-checked against your own estimates.
| Cost Category | Unit Driver | Monthly Range |
|---|---|---|
| Electricity | 200-400 kW installed; kW × hr × $/kWh at $0.08-0.15/kWh |
$3,500 – $9,500 |
| Water | 1.5-3 m³ per ton flake; closed-loop cuts intake 60-75% | $500 – $1,800 |
| Chemicals (caustic, defoamer) | NaOH 4-8 g/kg flake at $0.40-0.65/kg | $700 – $2,200 |
| Labor | 6-12 FTE per shift × $4-22/hr (region-dependent) | $2,000 – $14,000 |
| Spare parts depreciation | 3-5% of equipment CAPEX per year, accrued monthly | $1,000 – $3,500 |
| Scheduled maintenance | 8-16 hr/month per major machine × $35-55/hr | $1,200 – $3,500 |
$8,000-$25,000 excludes the procurement of feedstock (landfilling expenses/ton of new waste delivered, 176 tons/mo). All estimates normalized to a single design 500 kg/h line.
Electricity is the line that surprises most operators. The EU JRC’s Environmental and Economic Assessment of Plastic Waste Recycling benchmarks average plant-level electricity consumption at 61.1 kWh/ton of recycled plastic—and that’s the ratio you should plug into any pro forma. At European industrial tariffs of $0.13-0.18/kWh, that intensity translates to $8-11 of electricity cost per ton of output, before any energy-efficiency upgrades. The IEA Sustainable Recovery Industry analysis estimates that “significant improvements” to the recycling infrastructure add an extra ~$500/ton of waste processed—a useful sanity check when comparing a low-bid quote to what genuinely capable lines actually cost.
Why the important?…
A plant operator running below 80% uptime spends almost the same OPEX whether the line is making pellets or sitting idle. Energy and labor barely move with throughput, but revenue collapses. The single best ROI investment after commissioning is whatever buys you the next 10 percentage points of uptime – usually spare wear parts inventory and a continuous melt filter.— Kitech engineering team, drawing on commissioning data from 500+ installations across 80+ countries
Closed-loop water recycling deserves a separate budget line. Plastic washing consumes 1.5-3 m3/ton flake; in regions with tight discharge regulations, a closed-loop system cuts intake by 60-75% and protects you from rising water-and-sewer fees, which have climbed 15-30% in many jurisdictions since 2023. The CAPEX for closed-loop is $20,000s-$80,000- usually paid back inside 24 months at industrial water rates.
Hidden Expenses — 5 Cost Categories Most Buyers Miss
If equipment is 40-50% of total project investment, the rest goes here. The 5-Category Hidden Cost Map below resolves the missing 50-60% into items you can budget against—not paragraph warnings about “facility costs” that vendors normally leave deliberately vague. These categories appear in commissioning audits with painful regularity, and ignoring any one of them is the single fastest way to blow past your CAPEX target.
| Category | Sub-Items | Typical Cost | % of Total CAPEX |
|---|---|---|---|
| Civil works | Reinforced floors (5 ton/m²), drainage, loading dock, ceiling reinforcement | $30,000 – $200,000 | 8 – 15% |
| Electrical upgrades | Three-phase substation, panels, transformers, power factor correction unit | $10,000 – $50,000 | 3 – 6% |
| Water + wastewater | Pre-treatment, settling tanks, closed-loop recirculation, discharge permits | $15,000 – $80,000 | 5 – 10% |
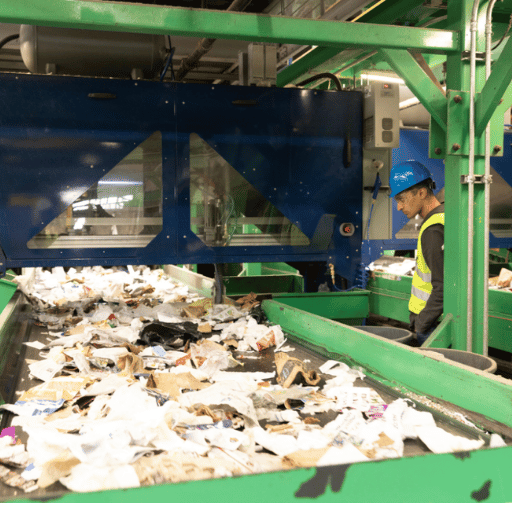
| Front-end sorting + QC | Manual lines, NIR optical sorter, metal detectors, in-line QC lab | $15,000 – $200,000 | 5 – 18% |
| Software + EHS + compliance | PLC + SCADA, OSHA combustible-dust controls, EHS plan, ISO 9001, EPA permits, operator training | $25,000 – $90,000 | 7 – 12% |
The following sub-items list is illustrative. Actual scope depends on local regulations, the condition of your facility, and the contamination level of your feedstock. Combined hidden expenses often add up to 40-50% of the total project investment, roughly aligning with the rule of thumb you find on the kitech homepage that “your total budget is approximately twice the equipment list price.”
Two safety and environmental considerations are embedded in the “Software + EHS” line that first-time investors seldom budget for. OSHA classifies plastic and rubber dust as combustible dust under its NEP, mandating grounded ductwork, hazard analysis, and explosion-vented bag houses in shredding and granulating zones—so $15,000-$45,000 is a capital expenditure not included in vendor quotes. Additionally, research by Iowa State University extension has shown that recirculated plastic-wash water can accumulate phthalate plasticizers, which implies that closed-loop systems might need a periodic blow-down and an activated carbon polish to comply with discharge permits—adding a $3,000-$12,000 to the annual operating costs.
What Hidden Costs Should You Budget for Beyond the Machines?
Two items inside the hidden table cause more budget overruns than the others combined. The first is permit waiting time — environmental operating permits can take 3-12 months in many jurisdictions, and once you sign a facility lease, every idle month costs $5,000-$20,000 in carrying expenses. APR’s 2026 Plastics Recycling Policy webinar documents how the patchwork of state Extended Producer Responsibility (EPR) laws now adds a permit-coordination layer on top of conventional environmental clearance. The second is power factor surcharges — large motors with poor power factor trigger utility penalties that quietly add $300-$900/month. A $2,000-$5,000 power factor correction unit erases the surcharge for life of the plant. Industry practitioners commonly report both items as the most under-budgeted line in first-time CAPEX models.
Cost by Material Type — PET vs HDPE vs PE Film vs Rigid vs Mixed
Your plastics stream – dominating one way or another 60-70% of your equipment selection – determines your capital cost structure by choice of feedstock.To know what you will pay (and recoup) for your equipment, you must determine your feedstock economics. PET by design demands hot caustic splitting to restore a food-contact rPET purity, while HDPE/PP require gritty friction-washing, LDPE film needs high-shear premixers and Z-counter-degassing extruders, and mixed rigid streams need front-end sortation equipment certain resin lines can omit. The following five-column matrix untangles the cost-and-revenue spread into one simple decision document.
| Material | Total CAPEX (500 kg/h) | OPEX / month | Recycled pellet $/lb | Payback |
|---|---|---|---|---|
| PET bottle washing line | $450,000 – $1,000,000 | $22,000 – $48,000 | $0.40 – $0.78 | 14 – 28 months |
| HDPE / PP rigid | $300,000 – $700,000 | $15,000 – $35,000 | $0.40 – $0.70 | 12 – 24 months |
| PE / LDPE film | $400,000 – $850,000 | $18,000 – $40,000 | $0.20 – $0.50 | 22 – 40 months |
| Mixed rigid plastic | $500,000 – $1,100,000 | $22,000 – $50,000 | $0.30 – $0.55 | 20 – 36 months |
| Agricultural film | $350,000 – $750,000 | $14,000 – $32,000 | $0.15 – $0.40 | 26 – 48 months |
Pellet pricing forecasts are for 2026. Smattering of regional pricing: IMARC’s European PET pellet research charts April 2026 – 8.58CN/kg or $1.30/kg rPET in Europe vs 6.72CN/kg or $0.95/kg in Northeast Asia; BusinessAnalytiq notes +28.6% YoY moves only in EU pellet pricing.
Float density is the dividing line between PET and PE/PP in any wash line: PET sinks; PE and PP float, so one tank does resin separation. Cost models without float density separation (industry standard for most film streams) can run PET-optimized lines for PE at 15-20% yield loss, but not vice versa. For the behavior of different plastics through the recycling chain, see our thermoplastics recycling guide.
End markets for food-contact plastics add an additional layer of CAPEX. Food-grade PET and PP must meet source control, decontamination, de-lamination, and process safety standards under U.S. FDA 21 CFR 174-178 and EU Commission Regulation 282/2008, adding 15-25% on top of standard PET CAPEX for decontamination heat wash chemistries, 3rd-party testing, and process validation documentation. Non-food commodity PET (fiber, strapping) escapes this wrinkle.
ROI & Payback — How Fast Can You Break Even?
Most guides let us look at one example and consider it an ROI road map; we treat an example ROI model, plus two more, because a 500 kg/h plant in a $0.10/kWh region, with $250/ton HDPE bales, such as Tetra Pak’s new Malaysian repacker, is different in economics from a 3,000 kg/h in a region drawing $0.16/kWh power and using $400/ton PET bales. The 3-Tier ROI Calculator below sorts out this difference.
| Tier | 500 kg/h HDPE | 1,500 kg/h Mixed | 3,000 kg/h PET |
|---|---|---|---|
| Total CAPEX | $345,000 | $900,000 | $2,000,000 |
| Monthly input throughput | 176 ton | 528 ton | 1,056 ton |
| Yield (sortable + sellable) | 70% | 68% | 75% (PET higher recovery) |
| Monthly sellable output | 123 ton | 359 ton | 792 ton |
| Monthly net (realistic) | $32,000 – $62,000 | $85,000 – $160,000 | $180,000 – $340,000 |
| Payback (realistic) | 14 – 22 months | 18 – 26 months | 20 – 30 months |
| 5-year NPV (10% discount) | ~$1.1M – $2.2M | ~$3.3M – $6.8M | ~$6.4M – $13.0M |
| 5-year IRR | 50 – 100% | 48 – 95% | 48 – 90% |
For “probably” scenario assumption is 70-80 percent uptime, during ramp up, middle of the range pellet prices (sustained cycle of virgin prices/ oil, no pollution tax rebate, no growth), stable import/export and feedstock contracts, thus sellable output (after yield adjustments from input throughput at 65-80 percent recovery based on EEA mechanical-recycling benchmark) is input throughput adjusted for yields. For “pessimistic” modeling assumption of 60-70 percent uptime, weaker pellet market, supply disruptions, payback period extends to 24-40 months. Based on 2010 OECD Global Plastics Outlook,secondary-resin pellet prices generally follow the virgin polymer and oil-price cycle, rather than the full collection-and-processing cost, which, in periods of heavy virgin production glut, drives monthly net all-in down 30-50% of the “probably” scenario and doubles the payback band shown above.
How Long Does It Take to Recover the Investment in a Recycling Plant?
Generally, field data and our own commissioning experience can corroborate 18-36 months as a safe conservative planning window for total startup investment (equipment+facility+working capital), with 12-22 months achievable on equipment cost alone for well-optimized mid-size plants. Three factors influence this the most: pellet selling price (particularly in EPR-strong markets), feedstock supply certainty, and uptime greater than 80%. Plants that fail financially typically underestimate ramp-up time and overstate first-year utilization.
Making the Plastic Wave 2025 from Pew Charitable Trusts estimates that government-side delay penalties (estimated at $27 billion/year additional collection and disposal costs) are motivating more EPR-funded subsidy programs into the market, which can compress the effective payback period by 6-12 months for permitted operators.
💡 Pro Tip
Before you agree on an equipment quote, compare your own NPV by inputing your raw material and energy prices into the ROI estimator. It accepts your own regional electricity prices, local pellet costs, and feedstock contract depending to show a project specific payback period, which is much more useful than the 18-36 month ‘rule of thumb’.
How to Cut 20-30% Off Your Total Investment
Equipment list price is what most buyers consider first. The 2 Equipment Multiplier Rule states overall project cost leaning toward about 2x the equipment quote – so the heaviest cost reductions are through reorganizing the multiplier not a 5% bid reduction. The five strategies here arise from commissioning info from over 80 countries, in order of potential reduction not convenience.
5 Cost-Cutting Tactics — Savings vs Risk
- Buy a complete line rather than separate machines (savings 12-18%). Integrated line uses common conveyors, control panels and water circuits. disadvantage is little competition; involve detailed interface specifications in the contract to prevent lock-in.
- Stay semi-automated where can have cheap and abundant labor – saves 15-22%. Keep PLC + manual feed instead of fully auto in markets where experienced labor cost $4-9/hr. High risk, labor headcount possibly 30-40% higher; reduce the risk by expanding to full automation when business booms.
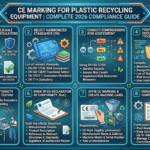
- Use CE/UL/CSA approved equipment from high-volume producers at competitive prices-30-45%. Chinese manufacturing lines, certified for CE, UL, and CSA standards, offer performance that ranges from 85 to 95 percent of European standards for a third to one-half the cost. Risks: import duty & lead time differences.Reduce risk by checking the documentation for certification against the appropriate certifying body (for CE check 2006/42/EC, for UL: UL 746S, and for CSA: C22.2)
- Lease and retrofit, do not build — saves $100,000-$500,000 vs new construction. Retrofitting an existing industrial building gets you operational months faster. Risk: ceiling height, floor loading, or zoning constraints; verify against equipment installation drawings before signing the lease.
- Modular phased CAPEX—delivers 30-40% reduction in first call. Begin with shredding + washing (selling flakes), add pelletizing when revenues permit. CAPEX risk: pellet-buyers prefer single-source chain; reduce risk by assuring a flake off-take partner before phase 1.
Two false economy lies to be wary of: buying used heavy equipment (blade life and bearing wear wipe out 20-30% sticker saving in less than 18 months); and removing optical sorter from combined feedstock (output rejection at purchaser costs 30-50% of pellet purchase price for the total rejected batch—way more than the $50,000-$100,000 would have cost at the outset).
Industry Outlook 2026 — Where Plant Costs Are Heading
Three market dynamics are impacting plant CAPEX economics through 2027. Understanding the magnitude and direction of each one can influence whether you choose to place your order in Q3 2026 or hold off for six months.
Regulatory tailwinds. The EU Packaging and Packaging Waste Regulation (PPWR) imposes legislated recycled content of 10-35% across plastic packaging by 2030, with a 65% recycling rate target for single-use plastic packaging also by 2032. Meanwhile, 12+ US states implement EPR activity with enforcement dates of 2025-2026. The simultaneous change is pulling textile demand for recycler capacity forward, and several state-level subsidy programs are already covering 30-50% of permitted CAPEX. The OECD’s Plastics Recycled Content Mandates commentary documents the policy convergence and pricing impact on the supply of rPET.
Equipment pricing pressure. Steel and electric motor costs are tracking 6-10% higher into the second half 2026, fueled by broad industrial demand and persistent raw-material problems. Energy efficiency gains to some extent are partly mitigating the inputs—Beijing’s Energy Efficiency 2025 industrial forecast model foresees a persistent –4-8% reduction in industrial electricity intensity over the 5-year calculation period, as productive installed base evolves. Effect on overall CAPEX in second semester 2026: upward bias 3-6% versus first semester 2026.
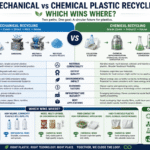
Mechanical vs advanced (chemical) recycling. The growth rate for advanced chemical recycling capacity is complex but at a rate exceeding 25% CAGR—however more than 80% of the total capacity installed is mechanical. Meanwhile, the market for plastic recycling is extremely diverse (estimating analyst projections range from $33.8bn to $72.7bn in 2025), but is settling in the consensus estimate at a $65-77 billion base by 2026—representing across-the-board double-digit growth, with output growth into 2030. For a given plant operator, the practical conclusion remains that in this equipment purchase category, mechanical solutions are the lower-risk approach through 2030, with chemical recycling solutions only aiming at the more problematic niche feeds: contaminated PET, mixed flexible film, but not yet significantly replacing the standard washing-and-pelleting stream—though keep a close watch on the trend; evidence suggests that EU capacity expansion (EA Mechanical Recycling), already surpassing the total volume of collected plastic waste in 2022, maintained its increasing percentage in overall exports—and this capacity must be used for EOL feed volumes. Feedstock agreement and policy enforcement will determine if these new facilities operate.
⚠️ Action — Lock pricing before Q3 2026
If your project schedule affords it, obtain firm quotes for equipment purchase before Q3 2026 to underwrite the initial cost base before steel costs escalate by a forecasted 6-10%. The timing for EPR subsidy application will also favor an earlier submission in most states.
Frequently Asked Questions
How Much Does a Recycling Plant Cost by Scale?
View Answer
Small 100-300 kg/h: $150K-$450K. Mid 500-1,500 kg/h: $400K-$1M. Large 1,500-3,000 kg/h: $800K-$2.2M+. Equipment is 40-50% of total.
What Equipment Do I Need to Start Plastic Recycling?
View Answer
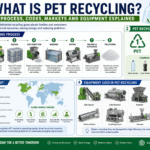
The basic line consists of a shredder, a washing system, a dryer plus (if producing pellet) a pelletizer with a melt filter. PET needs caustic wash+float- sink separation; PE/PP need high-force friction wash; film needs a squeezer and a special ex- truder screw for byproducts degassing. Turnkey lines integrate all 4 blocks with a common control panel and conveyor system and cost typically 10-15% less than buying the blocks for a 4-step process separately.
Should I Produce Flakes or Pellets?
View Answer
The flakes are less expensive in CAPEX (see $80,000-$200,000 for the line) and easier to run; the pellets deliver 20-40% higher price in the market but they involve deploying another $50,000-$150,000 on the pelletizer installation plus more attentiveness in the process management. If you have to start from scrap with limited capital, start with flakes and invoke the pelletizer once the cash flows flow.
Should I Buy Chinese-Made or European-Made Recycling Equipment?
View Answer
Triple-certified Chinese-equipment (CE 2006/42/EC + UL 746S + CSA C22.2) offers 85-95% of EU performance at 30-50% less costs are the ever so practical for ROI projects in most markets: When EU funds make “made in EU” obligatory (waiting for approval for purchase), when you’re recycling medical grades or for otherwise relevant clinical material, when there’s a service office near. All 3 certifications, if relevant, must be available the standard number with the issuing agency before signing the contract!
Is Buying Used Plastic Recycling Equipment Worth It?
View Answer
Used equipment may knock off 20-30% of the sticker price but will see blades dull, bearings wear, control expansion fatigue within 18 months. The only exception is shredders: a used shredder with spare blades and bearings may be worthwhile buying; pair that with a new washing and pelletizing line down the conveyor. We cannot recommend second hand pelletizers under any circumstance: The wear of the screw and barrel is just too expensive a buyout without dismantling.
Is It Cheaper to Buy Individual Machines or a Complete Recycling Line?
View Answer
Turnkey lines can get 10-15% reduction to the sum of the single-piece units thanks to shared conveyors, panels, water systems and wiring; also, turnkey lines allow faster commissioning (less interface problems). The higher throughput, over 300 kg/hr, and the more than 2 shifts/year operation feel these 10% less, too.
Get a Custom Plant Cost Quote in 48 Hours
About This Cost Guide
The CAPEX and OPEX ranges in this 2026 plastic recycling plant cost guide draw on engineering data from 500+ kitech installations across 80+ countries, cross-referenced against EPA, OECD, IEA, EU JRC, and Pew Charitable Trusts publications. Numbers reflect Q1 2026 conditions; prices fluctuate with steel and electric motor costs and may not reflect current market beyond six months. Where data points are based on industry synthesis rather than direct measurement, language has been kept appropriately tentative.
References & Sources
- Financial Estimates to Modernize Material Recovery Infrastructure (2024) — U.S. Environmental Protection Agency
- Plastics Recycled Content Requirements (2024) — OECD
- Energy Efficiency 2025: Industry — International Energy Agency
- Sustainable Recovery: Industry — International Energy Agency
- Environmental and Economic Assessment of Plastic Waste Recycling — European Commission Joint Research Centre
- Packaging and Packaging Waste Regulation (PPWR) 2025/40 — EUR-Lex / European Commission
- Breaking the Plastic Wave 2025 — The Pew Charitable Trusts
- Plastics Recycling Policy 2026 — Association of Plastic Recyclers (APR)
- Why We Should Be Bullish on Extended Producer Responsibility — World Economic Forum
- PET Pricing Report 2026 — IMARC Group
- The Role of Plastics in Europe’s Circular Economy — European Environment Agency
- EU Plastic Waste Mechanical Recycling Capacity — European Environment Agency
- Global Plastics Outlook — Secondary Markets — OECD
- Recycled Plastics in Food Packaging (21 CFR 174-178) — U.S. Food and Drug Administration
- Commission Regulation (EU) 2022/1616 — Recycled Plastic Materials in Food Contact — European Commission (supersedes 282/2008)
- CPL 03-00-008 Combustible Dust National Emphasis Program — U.S. Occupational Safety and Health Administration
Related Articles
- Plastic pelletizing machine cost — single-machine economics for the most expensive component in your line
- How to start a plastic recycling business — feedstock contracts, off-take agreements, and licensing checklist
- Thermoplastic recycling guide — how resin behavior shapes equipment selection
- PET bottle washing line: selection, costs & ROI — deeper dive on the most CAPEX-intensive material stream