Get in touch with Kitech Company
Plastic pollution is the accumulation of man-made plastic in soils, rivers, seas and atmosphere, which has now penetrated all levels of the natural environment. The production of plastic globally reached an estimated figure of 460 million tonnes in 2019, however 91% of these plastics have not been recycled and instead are dumped, incinerated or released into environment worldwide. This publication explains the facts, statistics on impacts of plastics on both marine lives and humans, structural barriers to effective action and the technological break through achieved by modern plastic recycling solutions from clearing up to making it a closed loop.
Plastic Pollution at a Glance
| Global plastic production (2019) | 460 million tonnes (OECD) |
| Annual plastic waste generated | ~350 million tonnes |
| Share ever recycled | ~9% globally |
| Leak into aquatic ecosystems | 19–23 million tonnes/yr (UNEP) |
| Reaching the ocean specifically | 1–2 million tonnes/yr (Our World in Data) |
What Is Plastic Pollution?
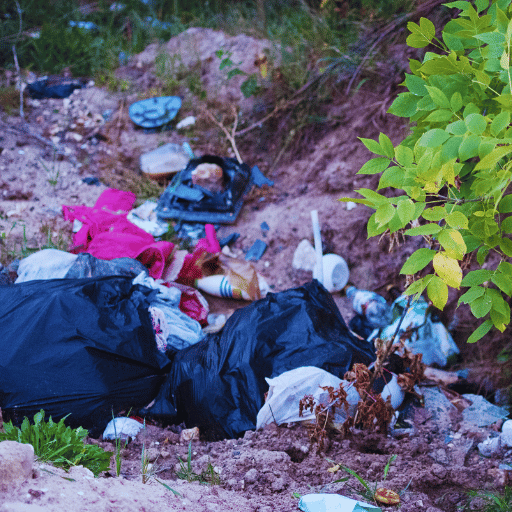
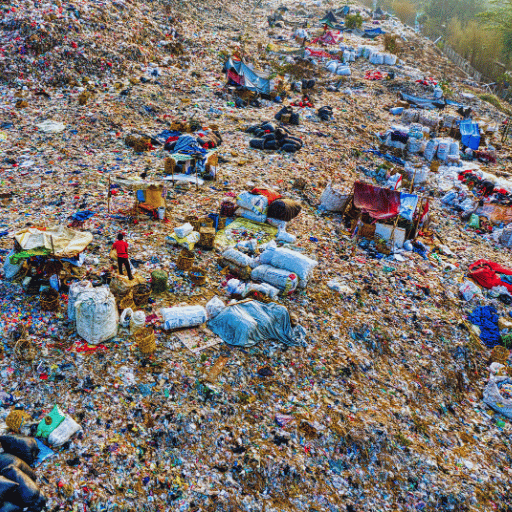
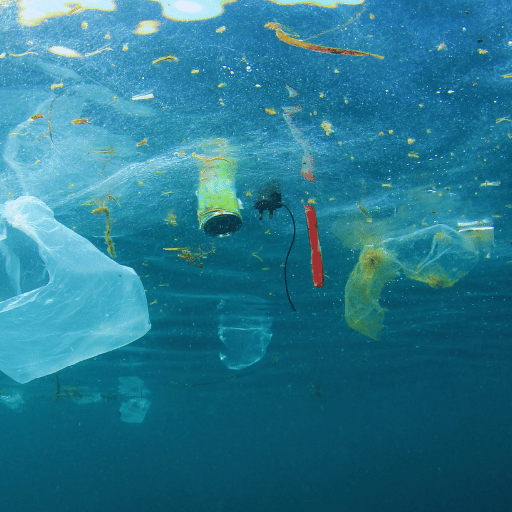
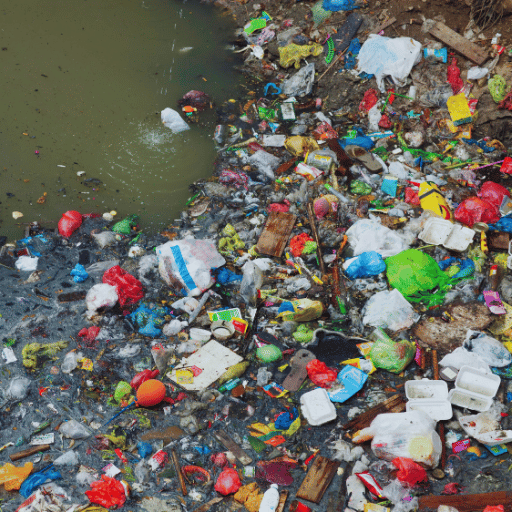
Plastic pollution is the result of the production, improper disposal and management of plastic products and particles entering the environment and causing harm to living organisms and the environment and more recently, to human health. It can take any form from a lone plastic bag entangled in a hedge to scale of something like a plastic debris patch in the Pacific. to microplastics that are spread through the atmosphere and the drinking water.
The key is permanence. A glass bottle we drop today will become sand, one way or another. A plastic bottle we drop today will take hundreds of years to break down to ever tinier pieces—that never will.
That, combined with the volume at which we now make the stuff—what made the useful plastic-bottle invention of the 20 th century into the pollution problem of the 21 st.
Plastic in itself isn’t the villain. It is the big discrepancy in the time we produce it, the short period we’re using the majority of them and the very slow process of collecting or reprocessing them. Recycling, in the classic sense, is only successful when feedstock is collected, sorted and reprocessed at industrial scale — which is where most of the world is still failing.
Causes & Sources: Where Plastic Pollution Comes From
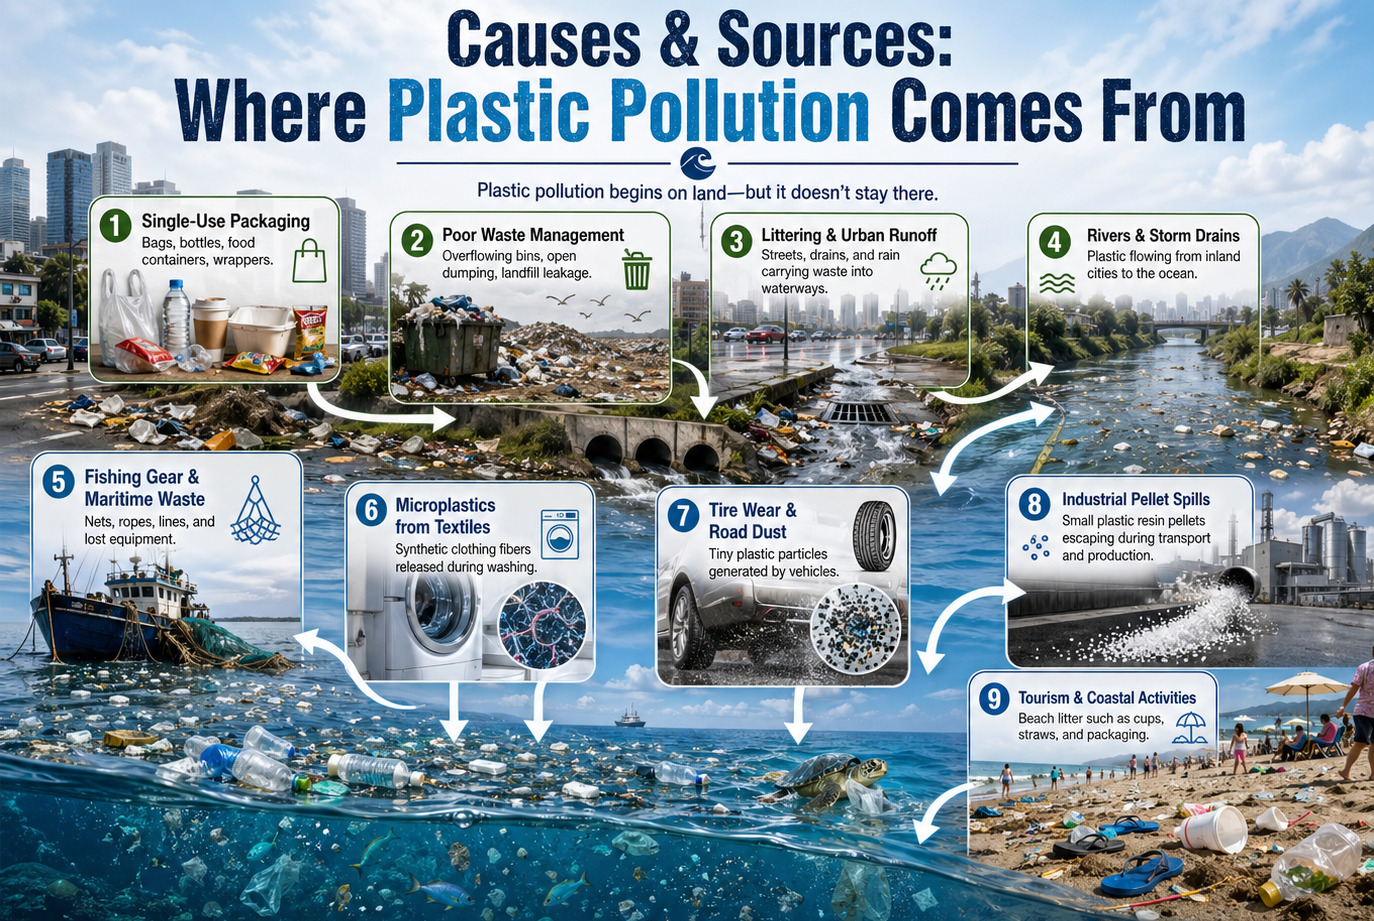
Plastic waste existed because of two related factors: a boom in manufacturing, and equally imbalanced global capacity to manage that waste. Plastic packaging accounts for around 40% of the millions of tons of plastic waste generated each year (Our World in Data), with other consumer plastics, hard building plastics, textiles and single-use plastic products filling the gap. The fate of each type of plastic — PET, HDPE, PP, multilayer film — differs sharply, which is why a single “recycle” label oversimplifies what actually happens to the plastic we use.
Most of the world’s ocean plastic isn’t from where most of the world’s plastic is produced. High income countries produce four times more plastic waste per capita than low income countries, but have the infrastructure to collect and dispose of that waste. Conversely, the pollution that reaches oceans is concentrated in middle-income countries, where rapid plastic use is rising fast and waste infrastructure has not kept pace
Top Five Country-Level Sources of Riverine Ocean Plastic
- Philippines
- India
- Malaysia
- China
- Indonesia
Together the five of them represent at least 70% of the plastic reaching the ocean through rivers (OWiD, after Meijer et al. 2021). This is related to coastlines’ geographers and capacity of waste-management not to the 5 groups of consumers.
That distinction is relevant when we come to solutions. A ban on plastic bags in Brussels will be very irrelevant in terms of plastic pollution in the Pasig River. The true bottleneck to most plastic pollution reaching our oceans is not “plastic is being used in excess” but is “the plastic we collect has nowhere to go”.
It touches a raw nerve that directly implicates sorting, washing and reprocessing facilities as the actual intervention point – that is the crux industrial plastic recycling solutions’ importance to the solution.
By the Numbers: 2025 Plastic Pollution Statistics
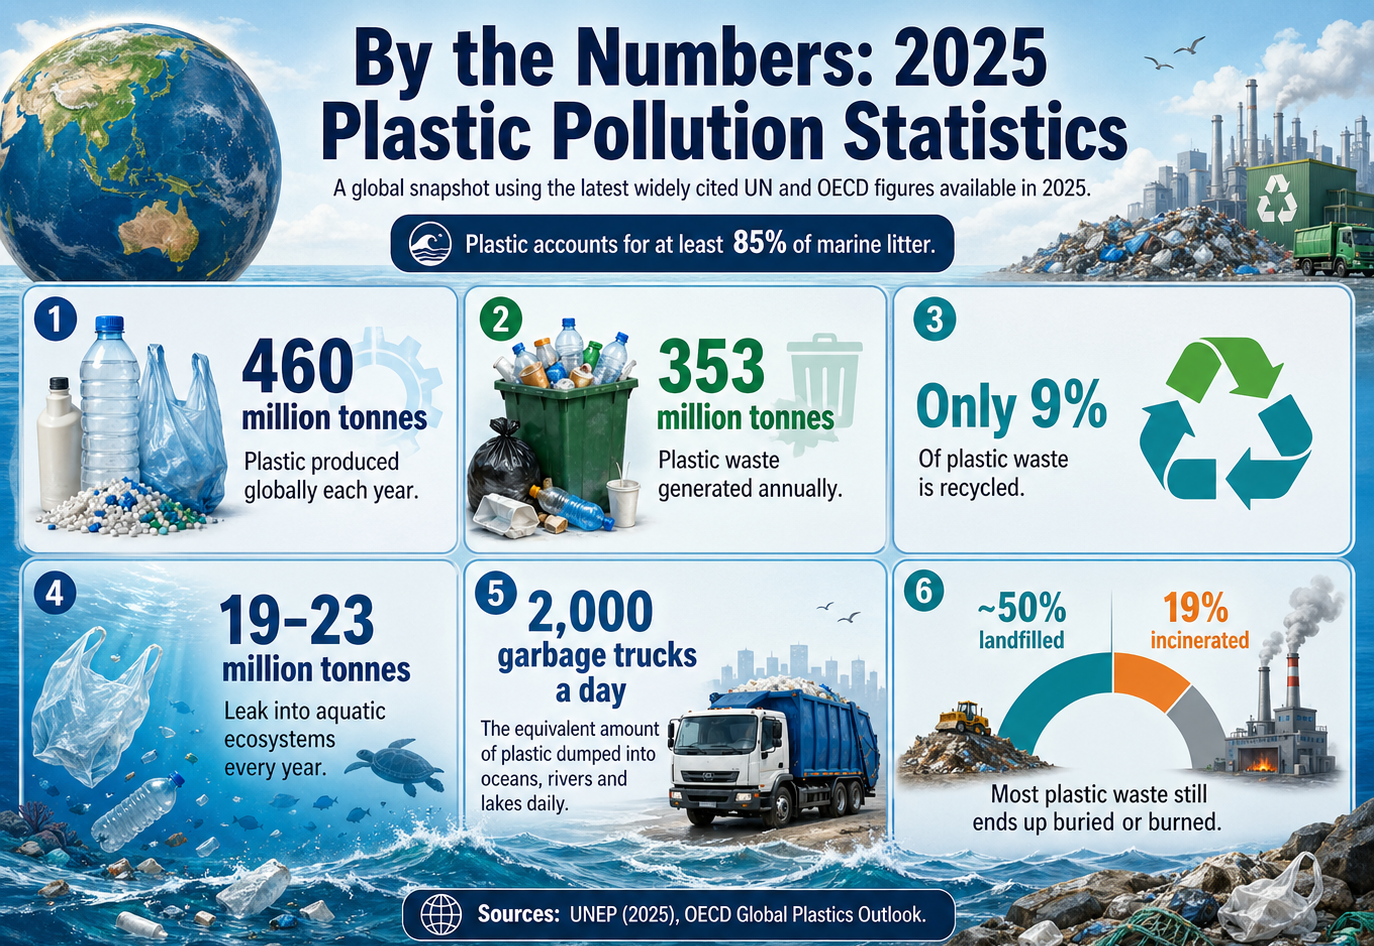
Listed below are the latest figures that intergovernmental and academic bodies use. Where competing estimates exist we show both and describe how the figures differ.
| Indicator | Value | Source |
|---|---|---|
| Global plastic production (2019) | 460 million tonnes | OECD Global Plastics Outlook |
| Projected production by 2050 | ~884 million tonnes | ScienceDirect 2024 modelling |
| Annual plastic waste generated | ~350 million tonnes | OECD / OWiD |
| Plastic leaking into aquatic ecosystems | 19–23 million tonnes/year | UNEP |
| Plastic reaching the ocean (current best estimate) | 1–2 million tonnes/year | OWiD / Meijer et al. 2021 |
| Share of plastic waste from packaging | ~40% | OWiD |
| Plastics’ share of global GHG emissions | ~3% | OWiD synthesis |
| Share of all plastic ever recycled | ~9% | OECD |
📐 The 9% Truth
After 70 years of plastic, recycling logos, household separation, the proportion of all plastic ever made that has really been recycled is still 9%. If that was the static 9% then no consumer behavior change, until it was 30%.
Two numbers are understandably confusing readers. The UNEP 19-23mt (million tonnes) versus the much more recent 1-2mt (Our World in Data). They are not contradictory figures.
They are stating different things. The UNEP figure considers any plastic that enters aquatic environments, water bodies, rivers, streams, lakes, seas, and even burn pile latents that pollute water bodies. The OWiD figures focuses on a hard figure: plastics reaching the ocean, not where they are emitted.
Older literature often presents this figure up to 8mit/year before hydrological modelling approaches, which estimate closer to 1-2mt/yr (Meijer et al., Science Advances 2021).
Impact on Oceans, Marine Life & Ecosystems
How much plastic enters the ocean each year?
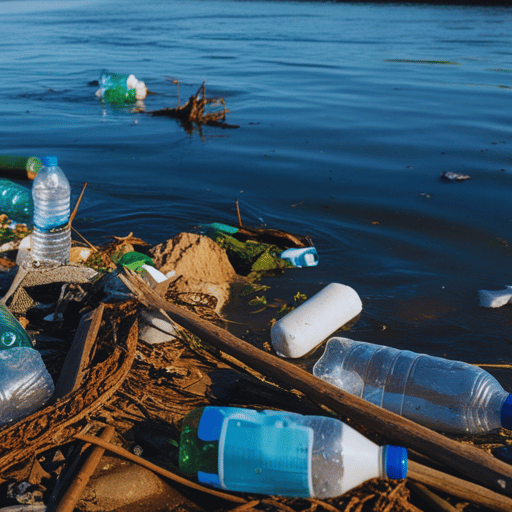
Today’s most defensible estimate is currently 1–2 million tonnes/year reaching the ocean from rivers, with an overall 19–23 million tonnes of annual leakage into all aquatic ecosystems per UNEP. Around 70% of plastics reaching the ocean from rivers come from five countries — Philippines, India, Malaysia, China and Indonesia — driven less by high consumption than by gaps in waste collection and disposal.
After reaching marine environments, plastic affects life in three ways—
Entanglement
Smysterious fishing gear (“ghost nets”) is causing the entrapment of marine mammals, sea turtles, and seabirds. The Great Pacific Garbage Patch is approximately 78% derelict fishing gear by weight (not consumer pack-ging).
Ingestion
More than 50% of the world’s species of sea turtles, and almost all of the seabird species examined, have ingested plastic. Plastic fragments lead to obstructions, false satiety and lowered reproductive productivity.
Habitat smothering
Coral reefs in contact with plastic debris had far greater incidences of disease. plastic mats on beaches hinder hatchlings of sea turtles from entering the water.
⚠️ Common Misconception
The Great Pacific Garbage Patch is not a solid floating island. It’s dispersed vortex of bits of microplastics and ghost nets that stretches over an area about twice that of Texas. As you drift your boat through it, you don’t see visible trash—that’s exactly what makes it so technically difficult to clean up.
That last point puts a whole new spin on the marine plastic saga. The image of an island of visible plastic frames the problem as something that we can literally sweep away. Given the reality—clouds of particles over potentially thousands of square miles—the one lasting solution remains to prevent plastic from entering waters in the first place, through collection, washing, and recycling on land.
Microplastics & Human Health: What the Science Shows
How does plastic pollution affect human health?
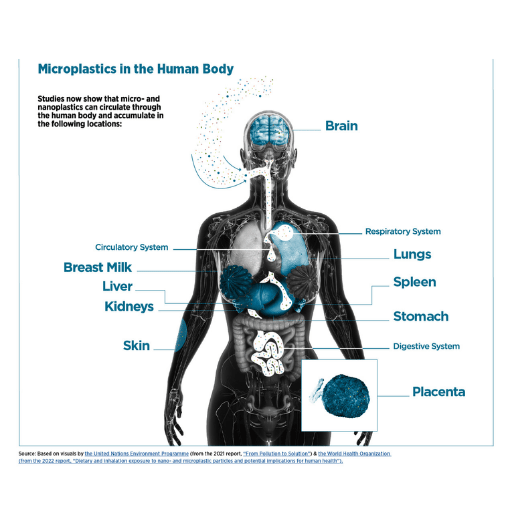
For close to ten years now, scientists were cautious: while microplastics were shown to be present in blood, lungs, breast milk, placentas, and stool samples, no study had crossed that line from “there is plastic in the human body” to “there is a human disease linked to this plastic”. This got a lot easier in 2024.
“Those patients with carotid artery plaque in which microplastics and nanoplastics were detected had a higher risk of a composite of myocardial infarction, stroke, or death from any cause at 34 months of follow-up than those in whom these substances were not detected.”
— Marfella et al., New England Journal of Medicine, March 2024
The Marfella study obtained plaque samples from 304 patients undergoing carotid endarterectomy. Patients whose plaque contained micro- and nanoplastics had a hazard ratio of over 4 for the composite cardiovascular endpoint compared with patients in whom plastic particles could not be detected. Harvard Health acknowledges that this does not demonstrate that plastics cause the increased risk—the presence of plastic in patients’ plaque may be correlated with other health detriments—”but this does represent the strongest signal of any study to date and raises the warning flag that the particle burden in human tissue is a clinically significant phenomenon.”
These mechanisms, putting inflammation, immune system derangement, oxidative stress and the effects of chemical additives into the spotlight, have already been identified in research undertaken by Stanford Medicine and Harvard School of Public Health:
- ✔
Food — fish, shellfish, salt, honey, tea bags shedding into hot water - ✔
Drinking water — both tap and bottled water test positive in repeated studies - ✔
Air — synthetic textiles, tire wear, dust from indoor environments - ✔
Skin and direct contact — cosmetics with microbeads, friction off textiles
⚠️ Common Misconception
There is no such thing as biodegradable plastic. Most so-called biodegradable polymers are more susceptible to breaking into microplastics when exposed to heat or sunlight—accelerating the production of microplastics in certain environments even before the plastic reaches an industrial composter. Such a label describes an ability, not an inevitability.
Climate & Environmental Costs Beyond the Ocean
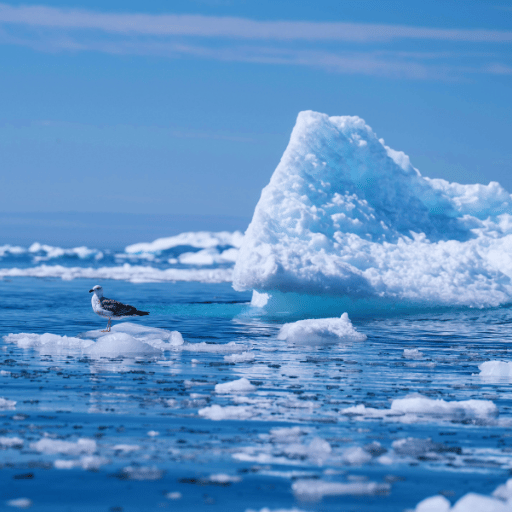
If littering is the concern, then focusing on plastic pollution is a red herring. Just as around 1% of fish in the ocean contain microplastics, so around 98% of plastic is derived from fossil fuel feedstocks. Emissions on all points of the plastics’ full lifecycle—from extraction through disposal—are responsible for over 3% of global greenhouse gas emissions, comparable to aviation, placing it as the dominant driver in spite of that fact that end-of-life treatment imposes much of the damage in the form of not just carbon, but particulate matter, air pollutants, and oversize thermal black carbon.
Climate
As a result of the lifespan lost to production and disposal, global emissions from plastics are expected to top 4.5 GtCOe by 2060, if output continues on its current growth path, encroaching over ~15% of the remaining 1.5C carbon budget.
Soil
Agricultural soils now experience greater levels of microplastics than the ocean surface in numerous regions: tire wear, sewage sludge, and mulch films are the largest contributors.
Air
For countries that burn waste unregulated, plastics emit copious amounts of dioxins and furans, embedded within the finest particulates, to attach to (alarming) health recommendations, remaining 9 years of life expectancy;—estimation of the ambient conditions worsening in circulation;In conclusion, if life cost left farovers, and the burden is tackling mangers together in other.
Why Past Solutions Haven’t Worked at Scale
Why is plastic pollution so hard to solve?
In short, it is each partial solution but each partial solution is blind to part of the problem. Recycling helps, plastic bag bans help, beach clean ups help, but none help closes the loop and after over 30 years and huge investments, the stagnating 9% global recycling figure shows that voluntary effort will not close it either.
The Three Structural Gaps
- Design for materials. Much consumer plastics are multi-layer or multi-colored or multi-polymer, which makes mechanical recycling either uneconomic or impossible without sorting investment.
- Collection capacity. Do not have it! A bottle in a bin on Manila that by design or failure never reaches sorting facility is the same as a bottle drifting in a river.
- End-market value. Recycled die, pellet has to compete for dollars against cheap virgin resin linked to oil prices. Without policy floors or recycled-content mandates this math often punishes recyclers.
⚠️ Common Misconception
“Any plastic can be recycled” is one of the most damaging messages of the last 40 years. In practice only some polymers (mostly PET, HDPE, and PP) are widely recycled at industrial scale. Most other resins are technically recyclable in a lab but unrecyclable in any municipal scheme.
Looking at those three gaps together gives a clearer answer: the real point of change is not on the consumer side, but on the infrastructure and design side. That is where modern post-consumer recycled plastics and advanced recycling technologies are.
How Recycling Technology Solves Plastic Pollution
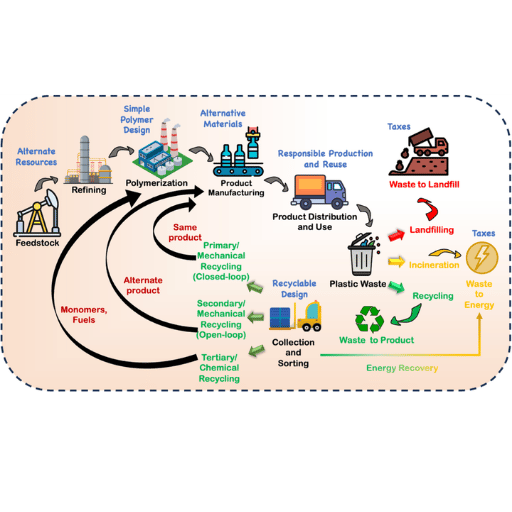
Plastic recycling technology no longer exists as one process. A 2025 review from the RSC Advances group breaks today’s methods into three families, each playing a different role in subbing virgin and containing waste prior to escaping.
| Family | What it does | Best fit | Output |
|---|---|---|---|
| Mechanical recycling | Sort, shred, wash, dry, melt, pelletize | PET bottles, HDPE/PP rigid, clean PE film | Flake or pellet for non-food and selected food-grade applications |
| Chemical / advanced recycling | Depolymerize or pyrolyze back to monomers, oils, or feedstock | Mixed plastic, multi-layer film, heavily contaminated streams | Virgin-quality polymer or refinery feed |
| Biological recycling | Enzymes and microbes break specific polymers (mostly PET) | PET, certain biodegradable polymers | Monomers for re-polymerization (early commercial scale) |
Mechanical recycling accounts for the majority of what takes place today and will continue to do so because it is energy-efficient and scaled. Chemical recycling fills the remaining need for long chain polymers or multilayer or heavily contaminated plastic film where mechanical barriers break down.
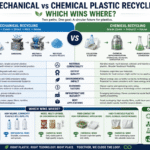
Mechanical vs. Chemical Recycling: Side-by-Side
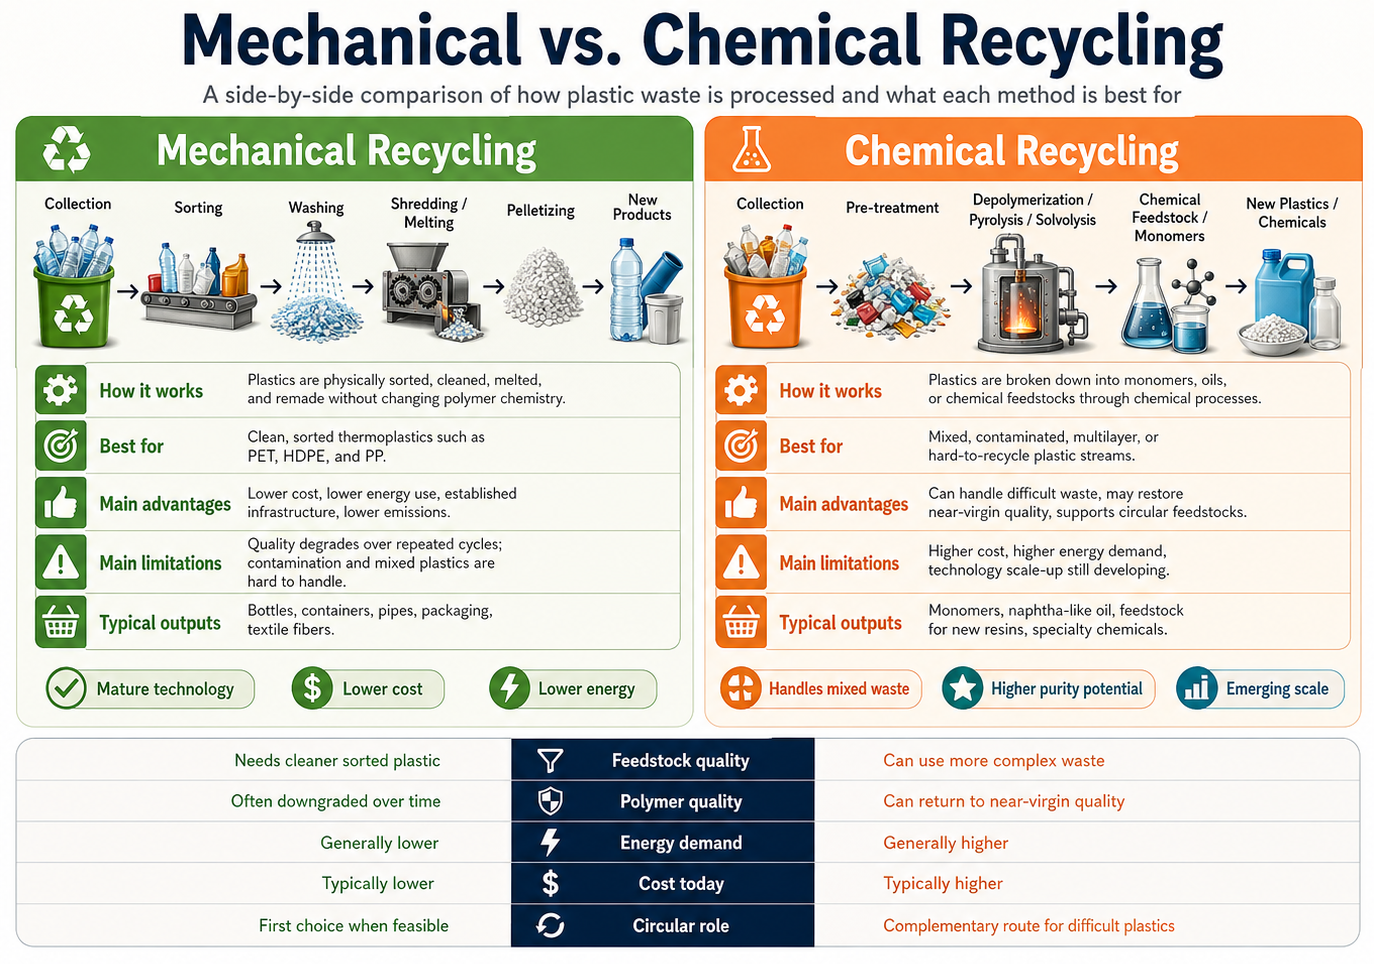
| Dimension | Mechanical | Chemical / Advanced |
|---|---|---|
| Capacity per line | 250–10,000 kg/h typical | Several t/h; large units 50–200 kt/yr |
| Polymer flexibility | Best with sorted, single-polymer streams | Tolerates mixed and multilayer streams |
| Output quality | Slight molecular-weight loss per cycle | Virgin-equivalent polymers |
| Energy & cost | Lower energy, lower capex | Higher energy, higher capex; benefits at scale |
| Maturity | Mature, decades of operating data | Commercial scaling, 2024–2030 buildout |
| Best end-use | Pellets for non-food packaging, fibers, building products | Food-grade polymer, hard-to-recycle streams |
📐 Decision Framework: Which Recycling Method for Which Stream?
- PET bottles, HDPE, PP rigid + acceptable contamination → Mechanical. Lower capex, proven, high-quality flake or thermoplastic recycling output.
- LDPE/PE film + manageable contamination → Mechanical with a dedicated film washing line; pre-shred, friction wash, then squeezing dryer.
- Mixed polymers, multilayer films, heavily contaminated waste → Chemical / advanced recycling. Mechanical economics fall apart here.
- Heavily UV-degraded or weathered material → Chemical. Mechanical loses molecular weight every recycling cycle, and degraded feedstock compounds the loss.
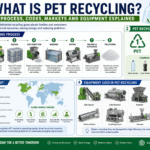
Inside Industrial Recycling: From Waste to Reusable Pellets
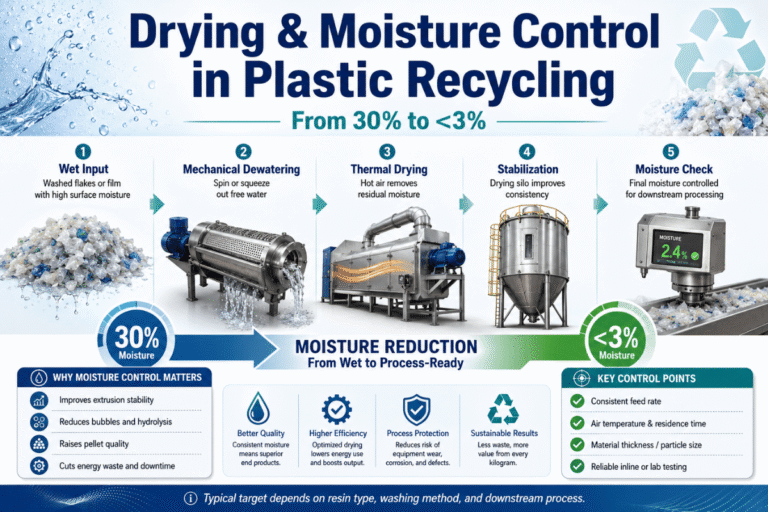
Mechanical recycling lines — the technology that today processes most of the world’s recovered plastic — comprise a five-stage process. Each stage has dedicated machinery, and each stage controls a different variable in the final pellet quality.
The Five Stages of an Industrial Plastic Recycling Line
- Sort. Manual selection and automated sorting by polymer (NIR sensors), colour and density. The output is a free-flowing stream of one polymer, at an acceptable contamination level
- Shred. Industrial plastic shredders make feedstock into acceptable flake. Single-shaft machines process dense rigid waste; two-shaft horizontal machines process bulky bales, un-wasted film, and tougher feed.
- Wash. Friction washers, hot-wash tanks, and density separation in plastic washing systems remove labels, adhesive, dirt, and light intermingled polymers. Hot wash in particular is critically important for PET going back into food-grade re-use.
- Dry. Mechanical squeezing dryers reduce residual moisture to approximately 3-5% before extrusion. Excess moisture causes problematic voids, gels, and makes pellet quality unstable down stream.
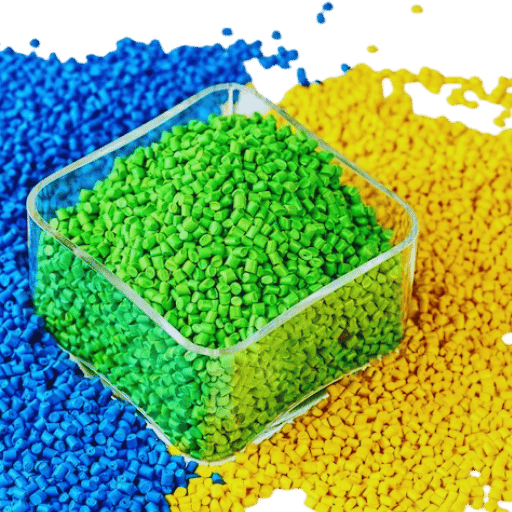
- Pelletize. Dedicated pelletizing machines with an extruder, die, and cutter produce contamination-free, standardized pellet feedstock to make new products. Self-cleaning laser filters trap remaining contaminants without line shutdown.
📐 Engineering Note
The quality of pellets depends more on the quality of stage 3 (washing) and stage 4 (drying) than on the quality of stage 5 (pelletizing). A pellet line fed with wet, contaminated feedstock will give out-of-spec pellets. Therefore, for retrofits, most bottlenecks come down to the washing system, and not chasing the highest through put pelletizer. For example, the largest contributor to maintaining food-grade flakes in a PET bottle washing line is hot-wash temperature, and the second is the shape of the friction screw.
This illustrates why blanket comments such as “we should just recycle more” omit the complex engineering underlying operational decisions. Indeed, large recycling lines operate on the basis of a sequence of physical process decisions, each of which has fundamental inputs and outputs. Perform the sequence accurately, a plastic that would Otherwise would be dumped in a river turns up as the next bottle, pipe, or pallet.
The Outlook: Plastic Recycling 2026–2030
Any one of three factors will influence plastic pollution response over the next four years.
3. The Global Plastics Treaty remains a piece of unfinished business. The fifth Intergovernmental Negotiating Committee (INC-5) in Busan, South Korea, ended in December 2024, without reaching agreement after a coalition of petrostates blocked binding production caps (U.S. State Department; CIEL). An INC-5.2, with a resumption scheduled for 2025, is where the negotiators are heading. Procurement and project teams learn; the regulatory backstop is pushed back, but the end-goal remains the same – production limits, recycled-content goals, Extended Producer Responsibility.
2. Capital investment is shifting towards chemical recycling. Plastics Europe has announced a capital expenditure plan from roughly 2.6 billion in 2025 to about 8 billion by 2030, with a hypothetical output of about 3.4 million tonnes per year of virgin-grade feedstock from chemical recycling. Alongside that, advanced mechanical lines (laser filters, multi-stage washing, AI-assisted sorting) are closing the margin with virgin resin. This is the decade when that comes to market.
3. Extended Producer Responsibility (EPR) is becoming the default, not the exception. On different timelines, U.S. states including Maine, Oregon, Colorado, California and Minnesota have all passed packaging EPR laws. The European Union’s Packaging and Packaging Waste Regulation continues to lower recycled-content ceilings by another decade’s worth. The incremental cost to brand owners of shelf-packaging that isn’t recyclable is continuing to rise—such that the brand side incentive to spec recyclable design is continuing to grow.
If you are planning capacity build-out in 2026-2027 timeframe, the best bet is zero exclusivity: mechanical lines that can take multiple feedstocks, combined with chemical-recycling output for stubborn streams. Winner will be those whose equipment and processes can take whatever regulation produces.
Frequently Asked Questions
Q: What is plastic pollution in simple words?
View Answer
Plastic pollution is the accumulation of plastic items and plastic debris in the environment- soils, water bodies, air, and now within living organisms. It is caused by the discrepancy between rapid plastic production and slow recycling and waste management systems.
Q: What country pollutes the ocean the most?
View Answer
For riverine ocean plastic, the primary emitters are the Philippines, India, Malaysia, China and Indonesia, contributing approximately 70% individually per Meijer et al. (2021). The per-capita and per-individual figures, however, are quite different- small island states frequently lead the per-capita lists.
Q: How long does plastic last in the environment?
View Answer
It varies according to polymer type and contact circumstances. A plastic bag can survive for 10-20 years; a PET bottle, several hundred years; a fishing line, around 600 years under water. Plastic does not necessarily disappear—rather it disintegrates into microplastics retained in soils, sediments and bodies for far longer than it appears to last.
Q: Is plastic pollution getting better or worse?
View Answer
Although production growth still persists and global recycling rate still hover around 9%, the absolute magnitude is worsening year-on-year. The EU and numerous US states are tightening packaging guide lines, but the volume of plastic currently in use continues to increase at a faster rate than collection and recycling capacity.
Q: Can plastic pollution cause cancer?
View Answer
Although conclusive evidence is as yet lacking, multiple plastic components (bisphenol A, phthalates, PFAS) are listed as endocrine disruptors known to be related to reproductive cancers. The 2024 NEJM report linked artery-plaque microplastics concentration to increased cardiovascular risk; cancer implications are currently under active research.
Q: Can recycling really solve plastic pollution?
View Answer
Recycling by itself will not work. Production of virgin plastics must be cut back, packaging designed for complete recyclability in mind, much-better waste collection infrastructure established, and mechanical and chemical recycling expanded concurrently. Recycling is a necessary part of the practical solution—it’s not its entirety- the system will collapse without it.
Q: What can individuals do to reduce plastic pollution?
View Answer
Make the shift away from one-use items (bottles, bags, portable containers)—-prioritize what your existing system is willing to accept for recycling, and support stronger packaging legislation at the local and national level. Individual action makes a difference; policy and infrastructure change is what moves the 9%.
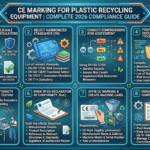
Building or Upgrading a Plastic Recycling Line?
KITECH offers complete systems for shredding, washing, and pelletizing PET, HDPE, PP, and PE film streams—CE/UL/CSA approved and available for dispatch within 60 days.
About This Analysis
This guide consolidates intergovernmental sources of plastic pollution data (UNEP, OECD), academic synthesis compiled by Our World in Data, peer-reviewed health evidence (including the recent NEJM 2024 Marfella team study linking microplastics and carotid plaques), and the latest treaty status as of INC-5 in Busan, Dec 2024. Praised by the KITECH engineering team which has over 25 years designing industrial plastics recycling lines using PET, HDPE, PP, PE film streams. Where two competing estimates are available for a quantity of interest—the two baseline ocean leakage numbers—both are shown with the developmental path including the serious methodological difference explained, rather than choosing one over the other.
References & Sources
- Plastic Pollution – United Nations Environment Programme
- Impacts of Plastic Pollution – U.S. Environmental Protection Agency
- Plastics Topic Page & Global Plastics Outlook – OECD
- Plastic Pollution – Our World in Data (Ritchie, Samborska & Roser, 2023)
- Microplastics and Nanoplastics in Atheromas and Cardiovascular Events – Marfella et al., New England Journal of Medicine, 2024
- Microplastics and Our Health – Stanford Medicine
- Microplastics Are Everywhere – Harvard School of Public Health
- Microplastics in Arteries Linked to Heart Disease Risk – Harvard Health Publishing
- Advanced Technologies for Plastic Waste Recycling – RSC Advances, 2025
- Outcomes of INC-5 – U.S. Department of State
- Consensus Fails Plastics Treaty Talks in Busan – Center for International Environmental Law
- Plastic Pollution — Encyclopædia Britannica
Related Articles
- Plastic Recycling Machine Guide – equipment selection across shred / wash / pelletize.
- Agricultural Plastic Recycling – handling mulch film, drip tape, and silage wrap.
- Zero-Waste Lifestyle – practical reductions on the consumer side.
- How to Start a Plastic Recycling Business – capacity, capex, and feedstock planning.
- Kitech Recycling – full equipment portfolio.