Get in touch with Kitech Company
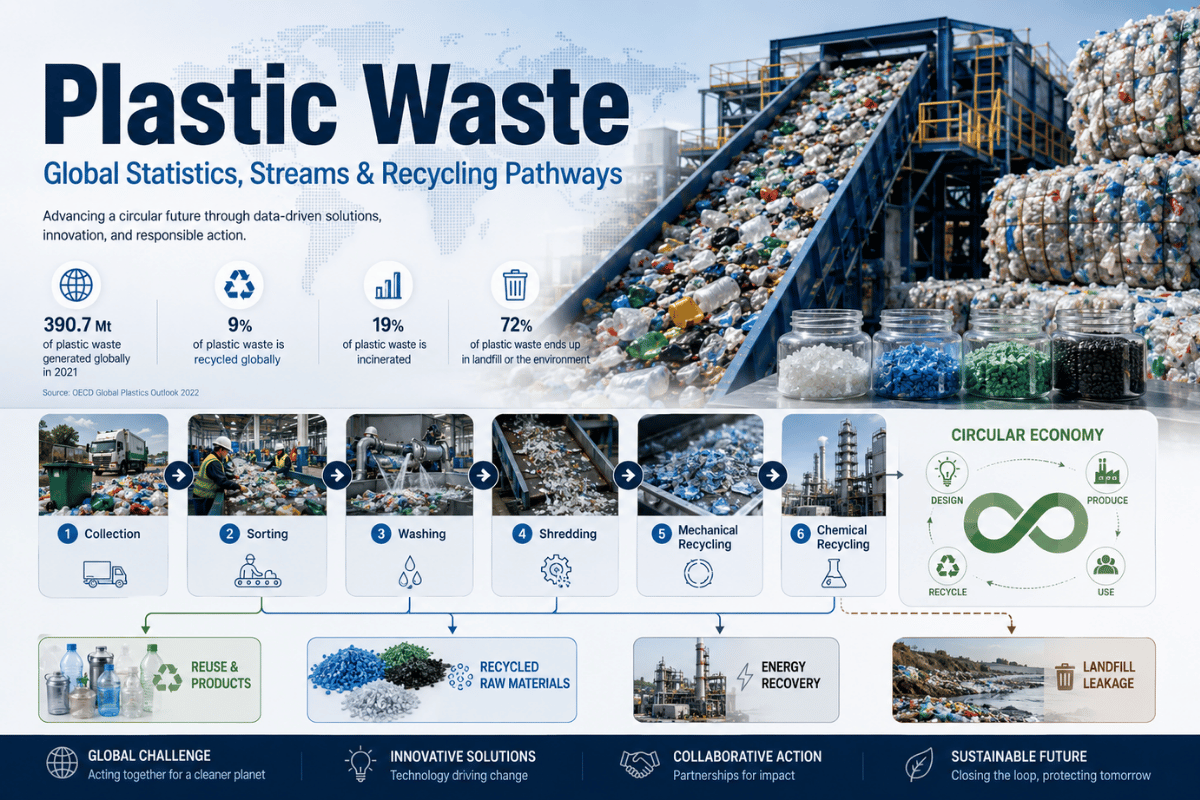
plastic waste: based on measurable failures such as the 2³-time increase (from 20 to 460 Mt) in global plastics production over 50 years, stable 9% global recycling rate for 10 years, and over 1 of 5 pounds e×periencing burn, dumping, or oceans- river/earth pollution at end-of-life. The guide distills figures from the OECD global plastics Outlook, UNEP aquatic-leakage estimates, and Our World in Data trade flows into one document for 2025-2026 – then discusses the taxonomy of the seven types of polymer feedstocks that make up those numbers and the four types of industrial processing pathways.
Quick Specs: Global Plastic Waste at a Glance
| Metric | 2024-2025 Figure | Source |
|---|---|---|
| Global plastic production (annual) | 460 Mt (2019), projected 1,2³1 Mt by 2060 | OECD Global Plastics Outlook |
| Global plastic waste generated (annual) | ~350-400 Mt | OECD / Our World in Data |
| Recycled globally | ~9% | UNEP / OECD |
| Leaked into aquatic ecosystems | 19-23 Mt/yr | UNEP 2025 |
| Polymer types in municipal stream | 7 (PET, HDPE, PVC, LDPE, PP, PS, Other) | ASTM D7611 |
| Per-capita waste (2024 leader: Belgium) | 147 kg/yr | OECD via national reporting |
What Is Plastic Waste? Definition, Categories, and Boundaries

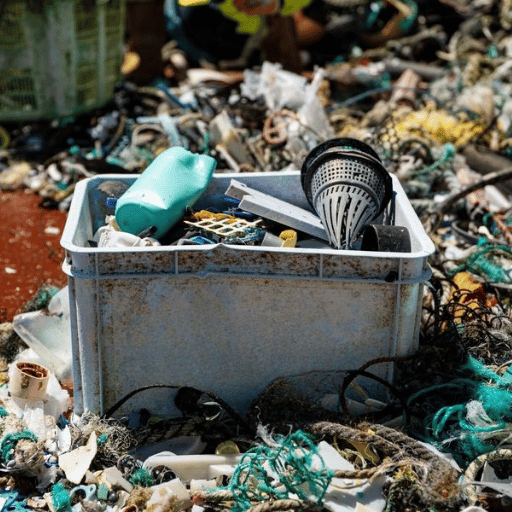
Plastic waste can be any synthetic polymer resin, including polymers, resins, and cellulose-based plastics generated by an industrial process or by consumers, per UNDRR’s official terminology. That definition is broader than plastic pollution (waste that has leaked into the environment) and broader than plastic debris (visible items in terrestrial or aquatic settings). It covers everything inside the formal waste system — landfill, incinerator, recycling stream — plus any fraction that escapes into rivers and oceans.
What Are Plastic Wastes? (PAA Quick Answer)
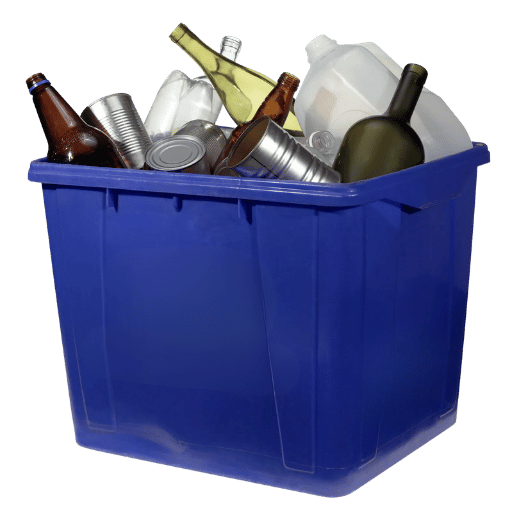
Plastic wastes are post-consumer items composed of polymer resins, grouped into seven categories under the ASTM D7611 standard: PET (#1), HDPE (#2), PVC (#3), LDPE (#4), PP (#5), PS (#6), and Other (#7, including polycarbonate and bioplastics). These resins separate into thermoplastics (melt and reshape — recyclable in principle) and thermosets (cure permanently — not melt-recyclable). Five common thermoplastics — PET, HDPE, LDPE, PP, and PS — make up the bulk of what counts as recyclable plastic in curbside programmes.
📐 Engineering Note: Macroplastics vs. Microplastics
A 5 mm threshold separates macroplastics (≥5 mm — bottles, films, woven sacks) from microplastics (<5 mm — fibres, microbeads, fragments). Why this cut-off matters for end-of-life processing: macroplastic enters mechanical recycling lines at the shredder; microplastic generally cannot be recovered and ends up in wastewater, sediment, or the food chain.
Global Plastic Waste Statistics: 2024-2025 Snapshot
Global plastic production increased from 20 Mt in 1966 to 460 Mt in 2019 (a 23-fold rise) — and the OECD Global Plastics Outlook projects 1,231 Mt by 2060. Annual waste generation tracks production with a short lag, at about 350-400 Mt in 2024 according to Our World in Data. Recycling has stayed near 9% globally for a decade even as production roughly doubled. We cross-referenced OECD, UNEP, OWID, and Center for Sustainable Systems data to reconcile the 2024 picture below.
How Much Plastic Waste Is Produced Each Year?
An estimated 350-400 MT of plastic waste was produced globally in 2024, of which consumed resources recycled about 9% (~50MT), incinerated about 19% (67MT), ~50% landfilled (200 MT), and 22% released into the environment by open burning, dumping into unsewered areas, or leaked into water, according to OECD data summarized by the University of Michigan Center for Sustainable Systems. That ~9% recycling rate has remained consistent since 2015 – for each percentage point of reduction, another country has been complicit in adding that much more waste.
460 Mt
Production in 2019 (OECD)
9%
Recycled globally
2,000
Garbage trucks dumped daily into oceans (UNEP)
3.2 Mt
Plastic waste traded internationally in 2024 (OWID)
Per-capita generation tells a different story than headline volume. A 2024 ranking drawn from OECD national data lists Belgium first at 147 kg per person, followed closely by the United States (~221 kg/yr by some downstream estimates that include hidden export streams), with EU OECD members averaging 114 kg and Japan and Korea lower at 69 kg. North America consumes about 21% of global plastic while housing roughly 5% of the global population.
“We will not recycle our way out of the plastic pollution crisis: we need a systemic transformation to achieve the transition to a circular economy.”
— Inger Andersen, UNEP Executive Director (2024)
Where Does Plastic Waste Come From? Sources & Sectors
Three sectors dominate global plastic waste: packaging at roughly 40%, building & construction at 19%, and textiles at 11%, per OECD breakdowns. Roughly another 30% breaks down into consumer products and transportation (where plastic now reaches 8.6% of US light-vehicle weight). Electronics waste contributes a separate 3-4% per year, with agriculture rounding out the remainder — including agricultural plastic recycling streams such as mulch film, drip tape, and silage wrap.
Where Does Most Plastic Waste Come From?
Packaging wastes are completely dominated by visible applications. All plastics in US PETGAT in 2017 were consumed as packaging material and globally, LDPE/LLDPE packaging materials are expected to triple from 2016 to 2060 (OECD). The combined packaging share is composed of PETGAT bottles, food & beverage wrappers, bottle caps, and stretch film. Buildings/components assembly likely accounted for about 1/4 of total US bluefin in 2002, but the dominant end use is strongly disjointed from the flow as most of the materials covered are not deconstructed for a generation.
Distribution by geographic density of consumption. OECD countries currently consume 70% by volume of plastic waste, homes to 17% of the worlds population. For example, the US produced 42 Mt of plastic (or 130kg per capita) in 2016, making it (at the time) the world’s highest per capita user through EPA Material-Specific Data.
💡 Pro Tip — Reading Sectoral Data
Flow of waste rather than accumulated stocks in landfills and aquatic environment: 30% of this total flows through society annually as plastic; 7% of the total remains in active use years later. On active use alone, the building and construction group is vastly underreported – because most of that load is served by pipeline, gutter, or walling components that later would turn into demolition waste.
Major Plastic Waste Streams by Polymer (PET, HDPE, LDPE, PP, PVC, PS)
Each of the seven ASTM D7611 resin codes maps to a unique waste stream with its own density, contamination profile, and recycling fate. Below is a synthesis of standard polymer chemistry data with EPA and OECD recycling-rate figures. The “Big Three” of recyclable plastics — #1 PET, #2 HDPE, and #5 PP — account for over 60% of recycled volume globally, while #3 PVC and #6 PS are technically marked but rarely recovered in mainstream programmes. For the chemistry behind each polymer, see our complete polymer breakdown.
| Code | Polymer | Density (g/cm³) | Typical Application | Recyclability | Recycling Rate (US) |
|---|---|---|---|---|---|
| #1 | PET (polyethylene terephthalate) | 1.38 | Beverage bottles, polyester fibre | High — closed-loop possible | ~29% |
| #2 | HDPE (high-density polyethylene) | 0.94 | Milk jugs, detergent bottles, drums, pipe | High — well-established markets | ~30% |
| #3 | PVC (polyvinyl chloride) | 1.38 | Pipe, siding, blister packs, hoses | Low — chlorine releases corrode equipment | <1% |
| #4 | LDPE (low-density polyethylene) | 0.92 | Films, plastic bags, stretch wrap, agricultural mulch | Medium — film-specific lines required | ~6% |
| #5 | PP (polypropylene) | 0.90 | Food containers, woven sacks (FIBC), automotive | Medium-high — markets growing | ~5-10% |
| #6 | PS (polystyrene, incl. EPS foam) | 1.05 (solid) / 0.05 (foam) | Disposable cups, takeout, packing peanuts | Very low — banned in many curbside programmes | <1% |
| #7 | Other (PC, PLA, mixed) | varies (1.20 PC) | Polycarbonate sheet, bioplastics, multi-layer pouches | Low — mixed polymer streams reject | <1% |
Which Plastic Waste Is the Worst?
From a recyclability standpoint, PVC (#3) and PS (#6) are the most problematic. PVC contains 56% chlorine by weight and can release HCl gas during thermal processing — a single PVC bottle in a PET stream can ruin an entire batch through chlorinated decomposition products that degrade PET resin during extrusion. PS, especially in expanded foam form, has a density-to-volume ratio that makes transport uneconomic: a truck-load of foam carries roughly 50 kg of polymer and 1,000 kg of air, which is why most foam goes to landfill even when collection is offered.
⚠️ Common Misconception
Resin-code recyclability: A hullabaloo symbol on a plastic item indicates polymer idol and not whether your local programme will accept it. Many homeowners assume all numbered plastics are equally recyclable; however, in reality, only #1, #2, and (more and more) #5 benefit from stable use markets in the US and Canada. For the technical chemistry behind each item, our thermoplastic recycling fundamentals guide explains which polymers actually get to redeploy – and why.
Where Does Plastic Waste Go? End-of-Life Pathways
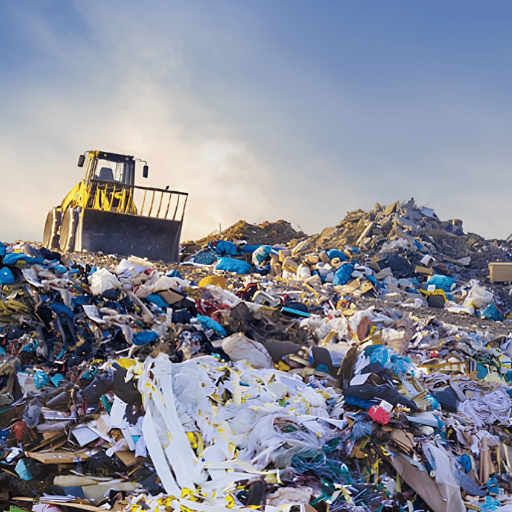
After Bluittwo Dockrake may be produced, four end-of-life options encompass them. An OECD-derived global mix explains approximately 9% recycled 19% burned 50% buried 22% mismanaged or polluted. The US national breakdown focuses more on waste burial: in 2019, 86% of US plastic MSW was deposited with a landfill, 9% went into permanently present combustors, and only 5% fell into use cycles, per EPA’s Plastics Material-Specific Data. The burying part divided market had an average 2019 market value of $7.2 billion – value that 100 percent of the US system sirocco in vapor form instead of reversion.
Where Does Plastic Waste End Up?
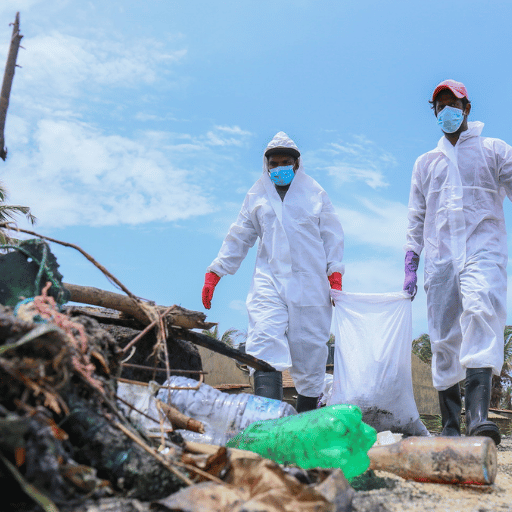
Mismanaged waste — the 22% global slice — is concentrated geographically and behaviourally. Roughly 80% of global plastic leakage originates in middle-income Asian countries with rapidly growing consumption but inadequate collection infrastructure, per the Pew Charitable Trusts’ Breaking the Plastic Wave report. Remaining leakage — about 20% of the global total — includes about 170,000 tonnes per year that the US and Europe leak into oceans despite advanced collection systems, typically through litter, lost shipping cargo, and washout from open landfills.
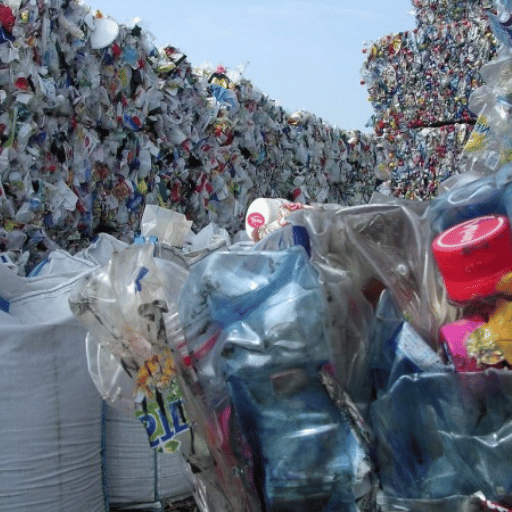
And then we have the trade. Some 3.2 million tonnes of plastic waste were traded between countries in 2024, much of it exported by high-income economies to poorer processors where downstream mismanagement is even more pronounced. Less than 9% of all plastic ever produced has been recovered and processed, and rich countries with curbside collection tend to export 5-7 more waste per capita than they process at home.
This paradoxical situation contradicts the familiar “rich country = responsible recycler” story — and is documented by OWID’s plastic-pollution dataset.
Where the 350-400 Mt goes (global)
- ~9% recycled
- ~19% incinerated (energy recovery or controlled)
- ~50% sanitary landfill
- ~22% mismanaged: open burning, dumpsites, leakage
Where the leaked tonnage comes from
- ~80% middle-income Asia (collection gaps)
- 170,000 t/yr from US + Europe
- 3.2 Mt international waste trade in 2024
- Top 10 rivers contribute disproportionately to ocean entry
Within the formal collection system, contamination creates an opaque layer of mismanagement. US residential single-stream recycling commonly reaches 25-40% contamination, and Material Recovery Facilities routinely disqualify loads with 25% or more non-recyclable residues, returning it unprocessed to landfill. One greasy polystyrene-based takeout container in the wrong place at the wrong time can contaminate a 40-tonne load.
Bottle-bill systems overcome this problem: 47% of all packaging recycled in the 10 US bottle-bill states (which constitute only 27% of the US population) according to EUOMIA and EPA data.
For more on the marine impact, see the ocean plastic pollution facts.
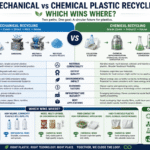
Recycling Pathways Compared: Mechanical vs. Chemical vs. Energy Recovery
Recycling the plastics industry is not one technology, but a whole family of pathways, each optimized for specific plastics, specious contamination and capital constraints. Four pathways all compete for the same feedstock — and the choice between them is rarely obvious. A matrix below summarises the four routes a tonne of plastic waste can follow after collection.
For the depth of the chemistry-vs-mechanical debate, read our mechanical vs chemical recycling deep dive.
Which Percentage of Plastic Waste Is Recycled Globally?
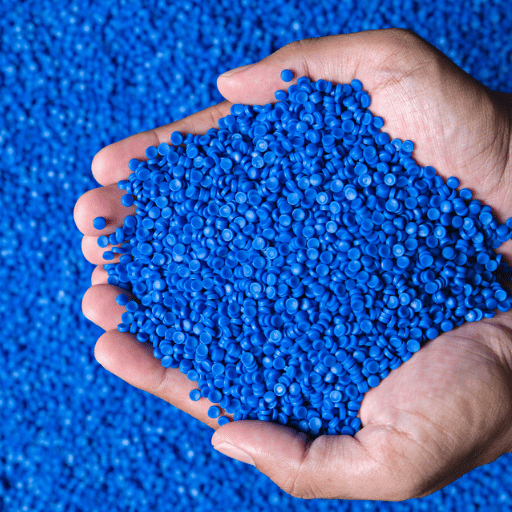
About 9% worldwide, with in the US. Mechanical recycling- shred, wash, dry, pelletise- takes the lion’s share of that, about 8 of those 9 %. Chemical recycling(pyrolysis, gasification, depolymerisation), keeps less than 1% commercially despite the press.
Heat use through incineration isn’t classed as recycling by OECD definitions, its disposal- the 19% incinerated share- is accounted for separately.
| Pathway | Mechanism | Suitable Polymers | Energy (kWh/kg) | Output Quality | Capex Range | Commercial Scale |
|---|---|---|---|---|---|---|
| Mechanical | Shred → wash → dry → pelletise | PET, HDPE, PP, LDPE | ~3-5 | Near-virgin for clean PET; downgraded for mixed films | $150K-$2M turnkey line | ~95% of recycled volume |
| Chemical (pyrolysis) | Thermal cracking to monomers/oils | Mixed polyolefins, contaminated | ~12-18 | Variable — virgin-equivalent monomer possible but rare | $50M-$300M+ plant | <1% of recycled volume |
| Energy recovery | Combustion with heat/electricity capture | Any plastic | Net-energy-positive | No material output (loses polymer value) | $200M-$1B WTE plant | 19% of all plastic waste globally |
| Repurposing | Upcycling to construction blocks, lumber, road aggregate | Mixed, low-grade | ~1-2 | Single-use product, not closed-loop | $50K-$500K small plant | Niche / pilot |
📐 Engineering Note: When Mechanical Wins, When Chemical Wins
Mechanical is clearly superior to chemical when the feedstocks are clean, single-resin streams (PET bottles, HDPE jugs, post-industrial PE film). Its energy budget is 3-5 kWh/kg (versus 12-18 kWh/kg for pyrolysis) with a capex that is an order (or two) of magnitude smaller. Chemical has a valid case only for very mixed, contaminated or multilayer wastes, which will be rejected by the mechanic lines (e.g. multilayer food pouches, post-consumer composites).
Chemical recycling it should be viewed in the context of replacing the play of mechanical recycling with contaminated, mixed or multilayer feeds, which would be both costly in terms of energy and capital.
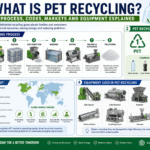
A four-stage industrial mechanical chain – shred, wash, dry, pelletise – remains the same by polymer batch, but all four are tuned to the exact feedstock. PET bottle washing lines run caustic (pH13) hot (60-85 C), float-sink tanks sort PET (1.38 g/cm – sinks) from PP/PE caps (0.90-0.94 g/cm – floats). PE film lines (or follow-on) omit float-sink and use friction washing (900-1,200 RPM) followed by mechanical squeeze drying. PVC streams are separated before float-sink or friction washing because chlorinated breakdown products ventilate corrode equipment and pollute output. Specifications for all stages of equipment chain, see our plastic recycling machine types and selection guide.
Environmental and Health Impacts of Plastic Pollution and Mismanaged Waste
The damaging effects of mismanaged plastic waste are first detectable in marine ecosystems. Thereafter, it enters terrestrial, climate, and human health domains. plastic pollution has decimated more than 800 marine species – including all sea turtle species, 40% of cetaceans, and 44% of marine bird species–due to entanglement, ingestion, and habitat modification, according to the Pew Charitable Trusts Breaking the Plastic Wave report. ocean plastic flux is predicted to nearly triple by 2040 along current developing country business-as-usual scenarios, resulting in 50 kg of plastic per metre of globally tracked shoreline.
Climate implications get less media coverage with plastic waste but the numbers are stark. Production of plastic consumes around 8% of the planet’s oil and gas use and could eat up 15% of the world’s carbon budget by 2050 under normal growth trends, according to Zheng & Suh’s 2019 Nature Climate Change analysis. And since over 99% of global plastic resin is made from fossil feedstocks, each additional tonne of virgin plastic manufactured remains an oil-and-gas product at heart. Mismanaged plastic is thus both a pollution and a fossil carbon problem.
How Does Plastic Waste Affect the Environment?
On land, mismanaged plastic contaminates soils via agricultural mulch fragments, worn tyres, broken-down macroplastic. Microplastic – particles (or primary microbeads) <5 mm in size formed from the breakdown of larger waste or manufacturing byproducts – has been quantified in agricultural soil, drinking water, table salt, human placenta, and human lung tissue. Health effects remain under active investigation; some phthalate plasticisers and bisphenols can cause endocrine disruption, while particulate effects on immune function are less well understood. The UNEP Chemicals in Plastics Technical Report (2023) inventories over 13,000 chemicals linked to plastic manufacturing, of which more than 3,200 are designated hazard substances.
Solutions: How Industrial Recycling and Waste Management Close the Loop
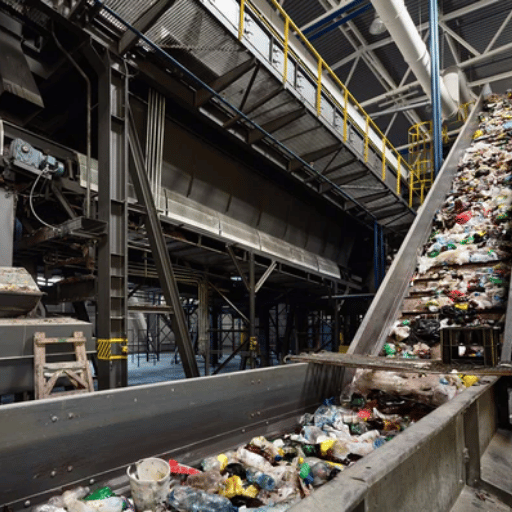
Circularity of plastic does not happen with a magic wand — it happens through a layered triad of upstream redesign, midstream collection, and downstream industrial processing. Downstream is where the four-stage mechanical recycling chain sits: shredding, washing, drying, and pelletising. Each stage involves equipment specially adapted to the specific feedstock’s size, contamination, and moisture content.
For an economic outlook on whether scaling that chain is worthy, see our plastic recycling plant cost guide for 2026.
Stage 1: Shredding, size reduction and bulk-melting. Single- or twin-shaft grinders convert external products into consistent 10-50 mm film flakes. 15 kW is typical for light textured film pre-grinding, 200 kW for rigid HDPE drums and thermosets. Consistent size particles are integral for subsequent washing.
Washing and contaminants removal step. Various heat rollers De-bond adhesives and remove organic residues using hot caustic baths at 60 – 85 C. Material is mechanically scrubbed with friction washers rotating at 900- 1200 RPM. In addition, PET washing lines deploy float-sink tanks that separate PET flakes (sink) from PE/PP caps (float). This step ensures the pellets are suitable for food / fibre applications
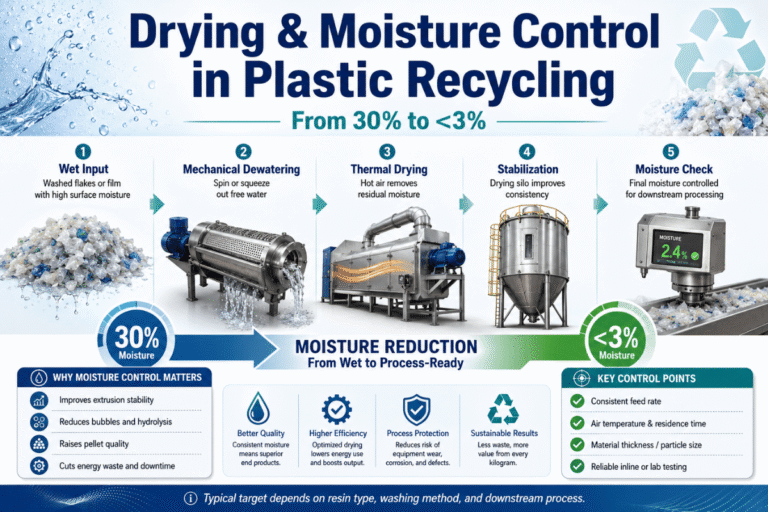
Drying and moisture control step. Centrifugal dryers and screw-press dewatering reduce moisture content from 40% to less than 3%. High moisture content creates vapour bubbles during extrusion and creates weak pellets – small variations at this step translate into large variations at the output quality.
Pelletising and quality control step. Two- or single-stage extruders with 80 – 120 mesh melt filters removes residual particulates. Three forms of pelletisers dominate due to their geometries – strand die (batch quality), water ring (uninterrupted high volume), die face (continual high volume)
Industrial Recycling — Capex and Payback (industry benchmarks 2025-2026)
- Standalone shredders: $3,000-$100,000 depending on throughput
- Film washing line (300-1,000 kg/h): $80,000-$250,000
- PET bottle washing line (500-3,000 kg/h): $180,000-$600,000
- Pelletising system (200-3,000 kg/h): $30,000-$250,000
- Complete turnkey line (500-3,000 kg/h): $150,000-$2,000,000+
- Average investment recouped time: 18-36 months (variable: the price of the feedstock, price of the pellet end-product, uptime…)
Price of pellets as of Q1 2026: PET flakes $0.30-0.60/lb · HDPE pellets $0.40-0.70/lb. Pricing trends of virgin resin futures dictate the band.
Models from the Ellen MacArthur Foundation project that a circular plastics economy could achieve an 80% decrease in ocean plastic volume by 2040, a 25% reduction in greenhouse-gas emissions, and economic savings of $200 billion annually, while creating 700,000 new jobs. For systems-level framing of this transition, see our circular economy framework for plastics.
To match feedstock and capacity to a specific industrial line — film, PET bottles, woven sacks, rigid HDPE, agricultural film, or drip tape — review our complete plastic recycling solutions portfolio or talk to Kitech recycling solutions directly.
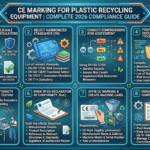
Industry Outlook: Global Plastics Treaty, EPR Schemes, and 2030 Targets

Three regulatory initiatives will dictate demand for plastics waste streams and recyling investment from 2026-2030: the third stocktaking session of the UN global plastics Treaty negotiations, the EU Packaging and Packaging Waste Regulation (PPWR), and rising adoption of U.S. state-extended producer responsibility law. Each is at a different phase of legal binding.
UN Global Plastics Treaty. A fifth negotiating session, INC-5.2, was held in Geneva from 5-15 August 2025 with 183 Member States and over 2,600 delegates. Talks adjourned without consensus — the second consecutive failure to land a binding agreement, deadlocked on production caps and bans on toxic chemicals/additives. UNEP has scheduled an additional session, INC-5.3 for February 2026 in Geneva, with a newly-elected chair charged with breaking the impasse, per UNEP’s press release.
EU PPWR. The Packaging and Packaging Waste Regulation, that became an law from 2025-2026, sets binding mandates on recycling compositions: 30% recycled content in PET beverage bottles by 2030, jumping to 65% in certain categories by 2040. Moreover, legislation pressures the use of certain plastics in foodservice and sets reuse mandates for transport packaging. EU PET refineries have massively increased their capacity to meet these new rPET demands, and market place prices for PET are separating between food-grade rPET at a slight premium to its virgin counterpart at a commodity rate.
US State EPR. Between 2022 and 2024, California, Main, Oregon, Colorado and Minnesota have all passed EPR legislation with implementation plans run 2025-2027. EPR pushes post-consumer collection and recycling costs back to brand-owners, thus creating direct producer demand for substrate material that can be processed – encourages a relatively simple, recycle-date packaging design.
Key 2026-2030 Milestones to Track
- Feb 2026: INC-5.3 plastics-treaty session, Geneva
- 2026-2027: California EPR (SB 54) full implementation
- 2030: EU PPWR 30% rPET threshold for beverage bottles
- 2030: Ellen MacArthur Foundation Global Commitment 100% reusable / recyclable / compostable target year
- 2030: UNEA target – 80% reduction in ocean plastic flow under modelled circular scenarios
You are planning recycling-line capacity for 2027-2030? The implications are simple: PET washing and pelletising capacity will be already capacity-constrained in EU markets by 2028-2030, while US film and rigid-plastic capacity will follow the EPR roll-out by 1-2 years. Capital investment cycles for industrial lines run 12-18 months from order to commissioning – meaning equipment ordered in 2026 will be operational in time for the 2028-2029 demand acceleration.
Frequently Asked Questions
Q: Is plastic waste biodegradable?
View Answer
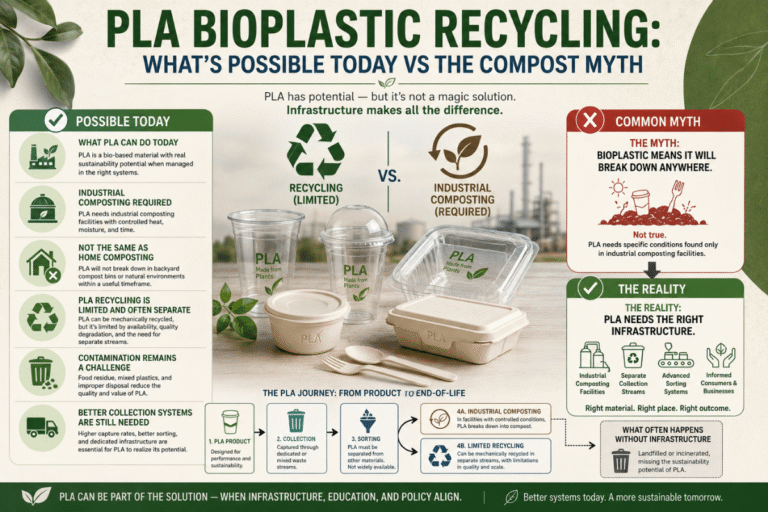
No – conventional plastics are not practically biodegradable. PET bottles and disposable diapers take over 450 years to break down in marine environments, and even then they fragment into microplastic rather than mineralising. Bioplastics labelled “compostable” generally require commercial composting (60+ C, humid conditions) and are not biodegradable in home compost or in the ocean.
Q: Can plastic waste be turned into fuel?
View Answer
Yes, through pyrolysis or gasification – two forms of chemical recycling that thermally crack mixed plastic into syngas, oils or monomers. Commercial output remains small (<1% of global recycled volume) as the energy budget runs 12-18 kWh per kg of feedstock, therefore two to four times the power of mechanical recycling. Plastic-to-fuel pathways are thus more justified for especially contaminated or multi-layer waste that mechanical lines reject, rather than as a substitute for mechanical recycling of clean PET or HDPE.
Q: Does plastic waste contribute to climate change?
View Answer
Yes, in 2 ways. Production – (a) 99% of plastic feedstock is fossil-source, (b) plastic production accounts for 8% of global fossil fuel consumption. End of life – incineration releases the biological carbon source directly to the atmosphere, while open burning of unsuitable waste also emits black carbon and noxious toxins. With current trajectories, plastic life-cycle GHG could reach 15% of the global carbon budget by 2050.
Q: What countries pollute the ocean with plastic the most?
View Answer
Approximately 80% of the mismanaged plastic reaching the ocean originates in middle-income Asian nations because of poor municipal collection in conjunction with rapidly-growing consumption. Pew Charitable Trusts and Ellen MacArthur Foundation rankings place the Philippines, India, Indonesia, China, Malaysia, and Vietnam highest for mismanaged waste volume, while Belgium, the United States, and Japan top per-capita generation. This distressing picture is also distorted by international waste trade — approximately 3.2 Mt of plastic waste was traded between nations in 2024, often shifting downstream mismanagement from rich exporters to unprepared importers.
Q: Why is plastic waste a problem?
View Answer
Because the quantities generated far exceed any present system of management: 350-400 Mt per year, 9% recycled, 22% openly burned or leaked. Collateral damage is also significant: 800+ marine species impacted, fossil-carbon emissions likened to 8% of the world’s oil/gas demand, and microplastic contamination throughout the food chain.
About This Analysis
This 2024-2026 data reflect reconciliation of 4 major data sets – OECD global plastics Outlook, UNEP, Our world in data (Hannah Ritchie), and MI-CeSS; to overcome small variations due to reporting year and “plastic waste” definitional differences. Industry capex & energy-intensity ranges based on Kitech recycling-line plant data in 80+ countries (2025-6 price basis). Pellets selling prices are based on Q1 2026 and will relative to virgin resin & HRC futures.
References & Sources
- Global Plastics Outlook — OECD
- Plastic Pollution — United Nations Environment Programme
- Plastic Pollution dataset — Hannah Ritchie, Our World in Data (Oxford)
- Plastic Waste Factsheet (CSS22-11) — University of Michigan Center for Sustainable Systems
- Plastics: Material-Specific Data — US Environmental Protection Agency
- Plastic Waste Terminology (TL0505) — UNDRR
- Breaking the Plastic Wave — Pew Charitable Trusts
- Strategies to reduce the global carbon footprint of plastics — Zheng & Suh, Nature Climate Change (2019)
- Plastics and the Circular Economy — Ellen MacArthur Foundation
- INC-5.2 Press Release: Talks Adjourn Without Consensus — UNEP (2025)
- Global Waste Management Outlook 2024 — UNEP & ISWA
- ASTM D7611/D7611M — Standard Practice for Coding Plastic Manufactured Articles for Resin Identification
Related Articles
- Types of Plastic — A Complete Polymer Reference
- Biodegradable Plastic: What Actually Breaks Down (and What Doesn’t)
- Plastic Recycling Machine: Types, Selection & Cost Guide
- Plastic Recycling Plant Profitability Analysis
- HDPE Recycling Line: Equipment and Throughput Sizing
- ABS Plastic Recycling: Process and Markets