Get in touch with Kitech Company
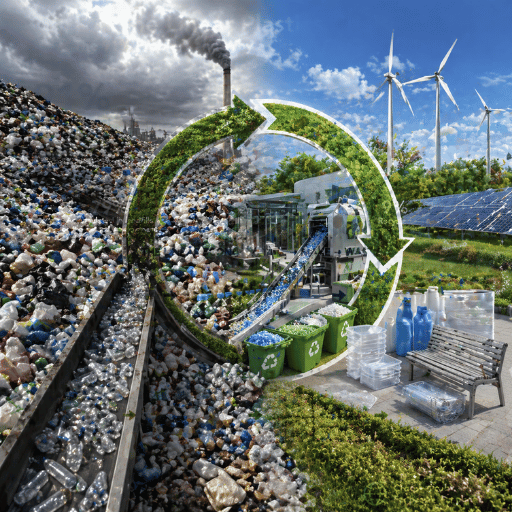
A circular economy for plastic is a system-wide redesign of the entire plastics system – so that material is used, not used up – by where we eliminate waste at the design stage, circulate products at their highest value in reuse and recycling, and regenerate the natural systems that linear plastic production has depleted. The own data after ³0 years of recycling-bin campaigns is unforgiving: only 9% of plastic ever produced has been recycled, the rest has been used up. Closing this gap is the challenge of the next decade.
Plastic Circularity at a Glance
| Global plastic production (2022) | 400+ million tonnes (OECD) |
| Recycled globally | 9% (OECD Global Plastics Outlook 2022) |
| Recycled in Europe | 26.9% (Plastics Europe 2024) |
| Annual environmental leakage | 19–23 million tonnes (UNEP) |
| EU 2030 packaging requirement | 100% recyclable / reusable (EU PPWR Article 6) |
| US states with packaging EPR (Apr 2026) | 7 — CA, CO, ME, MD, MN, OR, WA |
The Linear Plastics Crisis: The 91% Problem and Why a Circular Economy Matters
If you add up every report on plastic pollution, one number dominates: 9%. This is the percentage of plastic ever produced that has been recycled, according to the OECD Global Plastics Outlook (2022). The other 91% has been incinerated (19%), buried in sanitarily landfilled (~50%), dumped unchecked, or leaked into the environment. The linear plastics economy – extract, produce, use, discard – is, mathematically, a 91% Problem.
This is not a recycling-rate failure. The problem is with the entire system. The Ellen MacArthur Foundation estimates that USD 80-120 billion of material value is lost from the economy every year because plastic packaging is used once and then discarded. UNEP’s “Turning Off the Tap” report (2023) shows that 19 to 23 million tonnes of plastic waste leach into terrestrial and aquatic ecosystems every year – the leading cause of marine plastic pollution and a significant contributor to microplastic contamination in food and drinking water.
9%
Recycled globally
$80–120B
Annual value lost
19–23 Mt
Annual leakage
3×
Production by 2050 (projected)
The single-use plastic packaging that dominates oceanic and global waste streams was never engineered to be returned to the system. Caps are a different polymer to bottles, films are laminated with metallic foils, coloring dyes pollute flows with contamination, residue from food degrades the quality of pellets. Unless we fundamentally change the design, the Ellen MacArthur Foundation projects that 30% of plastic packaging will never be reused or recycled, regardless of how advanced collection systems are. This is the mechanical reason why a circular economy for plastic is not just desirable but ultimately inevitable – it is the market-responsive solution proportionate to the problem. For a basic overview of the technicalities, see what recycling actually means in technical terms.
What Is the Circular Economy for Plastics? Definition and Core Principles
A circular economy for plastic is a model of economics in which no polluting plastic product or packaging is ever manufactured with the expectation that it becomes waste. This is achieved by designing plastic products never to turn into waste or pollution, keeping materials in industrial or biological cycles via reuse, recycling, or composting, and regenerating the natural environment instead of depleting it. The following is the fundamental premise of every credible circular plastics agenda today.
“The circular economy is a systems solution framework that tackles global challenges like climate change, biodiversity loss, waste, and pollution. It is based on three principles, driven by design: eliminate waste and pollution, circulate products and materials at their highest value, and regenerate nature.”
— Ellen MacArthur Foundation, Plastics and the Circular Economy deep-dive
What Is the Difference Between Linear Economy and Circular Economy?
The linear economy is a take-make-dispose cycle. Raw materials—overwhelmingly fossil resources for plastic—are extracted, processed into products, used very briefly, and then disposed of. Economic value is capitalized once, at the moment of sale, and leaks out of the system. The circular economy retains value in-stream. Materials flow paths are constructed so they re-enter the production system, either as the same product (reuse or remanufacturing) or as a raw material for manufacture of new products (recycling). Pollution and waste are design failures, not externalities.
| Dimension | Linear Economy | Recycling Economy | Circular Economy |
|---|---|---|---|
| Material flow | Take → Make → Waste | Take → Make → Recycle → Downcycle → Waste | Designed loops, no waste |
| Design priority | Cost + function | Recyclability after use | Elimination, reuse, recyclability — in that order |
| Virgin plastic dependency | Maximum | High (recycled material supplements) | Decoupled from finite resources |
| Outcome | Pollution + value loss | Slower decline | Sustained material productivity |
The Ellen MacArthur Foundation’s six-point plan for a new plastics economy makes this hierarchy clear: eliminate problematic and unnecessary plastic packaging first, scale reuse systems that work for at least 20% of single-use packaging, make all plastic packaging 100% reusable, recyclable, or compostable, ensure that it is then reused, recycled, or composted in practice, decouple plastics use from scarce resource inputs, and contain hazard chemicals in the system. Recycling is necessary but never enough in this paradigm—see a zero-waste mindset for plastics for further consumer-focused discussion.
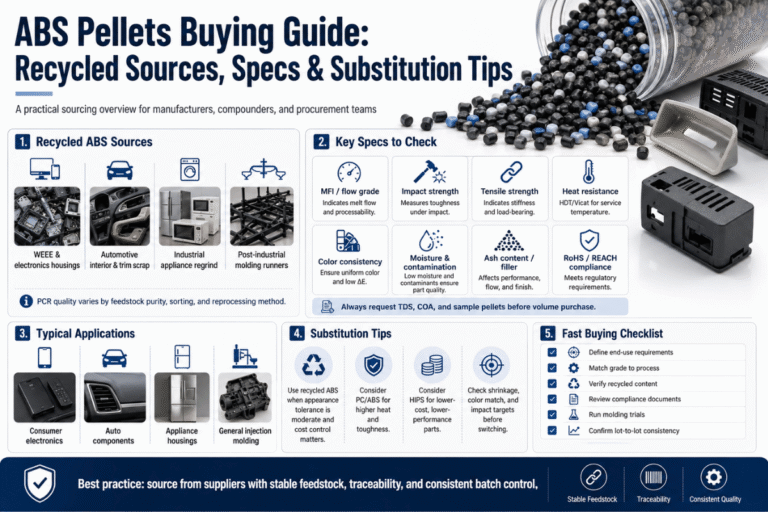
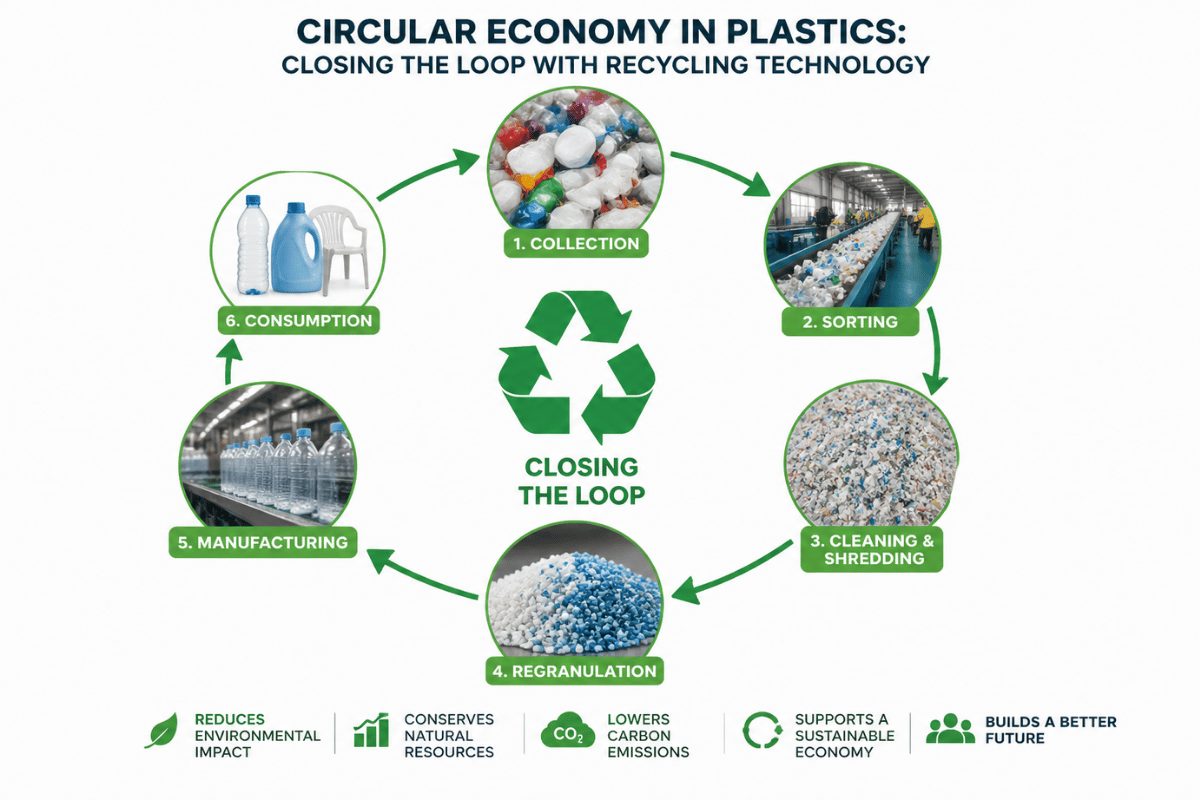
Mechanical Recycling: The Workhorse of the Circular Plastics Loop
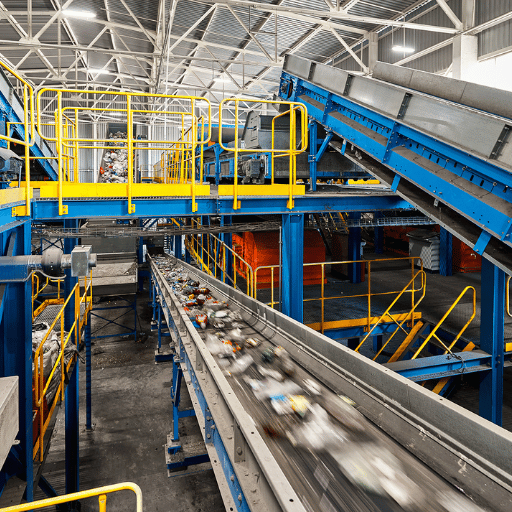
Mechanical recycling forms the basis of modern plastic circularity at industrial scale. Post-consumer plastic is recovered (through collection, cleaning, sorting, and transport), separated (via float-sink or air separation of different polymer types), processed (with feedstock generated in a four-stage process optimized for the material), and remanufactured as feedstock for other manufacturing operation. Europe is leading by example, achieving a 26.9% plastics recycling rate through mechanical pathways (Plastics Europe Circular Economy Analysis 2024)—triple the global average and the benchmark for what mature collection plus processing can deliver.
The four stage process is important because each process stage requires a quality gate, and ignoring or skimping on any stage ultimately devalues the whole pellet:
- ①
Size reduction — single- or twin-shaft plastic shredders (15–200 kW) reduce baled feedstock to 10–50 mm flake. Uniform particle size is what makes downstream washing and pelletizing possible at all.
- ②
Washing — friction washers at 900–1,200 RPM remove surface dirt; hot caustic baths at 60–85°C dissolve glue, label residue, and food contamination. PET bottle lines add float-sink tanks (PET sinks, PE/PP caps float).
- ③
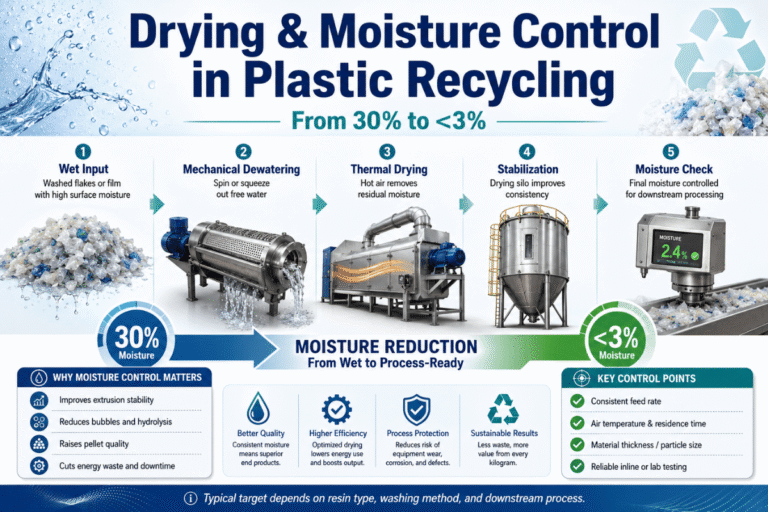
Drying — centrifugal dryers and screw-press dewatering reduce moisture from ~40% to under 3%. Excess moisture causes blowing bubbles in the extruder and weak pellets.
- ④
Pelletizing — single- or two-stage extrusion with 80–120 mesh melt filters strips fines and dyes; strand, water-ring, or die-face cutters produce the final pellet. This is the form recyclers sell.
📐 Engineering Note — Why Density-Based Separation Drives Line ArchitecturePET (1.4 g/cm3) has a specific gravity higher than water (1.0 g/cm3). Polyethylene and polypropylene are less dense (0.91 g/cm3).PET bottles use fresh weight-saving water float-sink separation after bottle washing to direct material to preform manufacturing (cap and label fragments float; PET sinks and is separated by gravity). Film lines do not bother with float-sink; instead, friction cleaner, water, and hot caustic handling of the lower-density material suffices. Therefore, processing film through a PET line, or vice versa, causes damage to both throughput and pellet quality.
Why Is Recycling Postconsumer Plastics So Challenging?
Though equipment costs are mature, mechanical recycling still struggles with chemistry. Peer-reviewed research examining technical performance barriers to mechanical recycling identified, among other issues, chain oxidation, free radicals, immiscible polymer pairs, gelation, and inorganic contaminant migration from one package to the next as fundamental technical limits. Several additives – stabilizers, plasticizers, flame retardants, etc. – are not chemically bound to the polymer as such, and they are not stable at the high processing temperatures used.
Mechanical recycling is also underpinned by a much bigger waste-management framework (sortation technology, collection logistics, customer end-market for pellets), so one weak link breaks the chain. There are two sets of design decisions which lead to this being neglected: carbon-black pigmented plastics (most automotive interior trim, many domestic products) break NIR sortation systems at material recovery facilities, as carbon black pigment absorbs NIR beam to become dark in colour, attracting it to residual waste; multi-layer flexible packs (laminites of PET, PE, and aluminimum foil) cannot be mechanically cleanly separated at all, regardless of operator skill. The honest framing for buyers and brand managers: recyclable does not mean recycled. Other conditions have to be right for a piece of plastic to close a loop: sortability, infrastructure access and end-market demand. For a deeper context on materials, see our guides to post-consumer recycled plastic content and thermoplastic recycling distinct from thermosets.
Chemical Recycling: Closing the Gap for Hard-to-Recycle Plastics

Chemical recycling, also called advanced recycling or molecular recycling, breaks plastic polymers back into monomers, oligomers, or hydrocarbon feedstock that can be repolymerized into virgin-equivalent resin. Three principal routes dominate the conversation:
| Pathway | Best Suited To | Output |
|---|---|---|
| Depolymerization (glycolysis, methanolysis, hydrolysis) | PET, polyamides, polyurethanes | Original monomers — true closed-loop |
| Pyrolysis | Mixed polyolefins (PE, PP), films, multi-layer | Pyrolysis oil — feedstock for steam crackers |
| Gasification | Mixed plastic waste, contaminated streams | Syngas — chemical building blocks or fuel |
How Much Can Chemical Recycling Contribute to Plastic Waste Recycling?
The honest answer in 2026 is: less than its advocates claim, and more than its opponents concede. The Ellen MacArthur Foundation makes a careful distinction which frames the whole debate. If chemical recycling feeds monomers back into the plastics industry, returning to virgin quality resin, then it is circular. If pyrolysis produces fuel for the refinery, and this is burned for energy, then it is linear – economically equivalent to incineration, but more complex in a supply chain cost sense. Thus far, the term ‘chemical recycling’ has been applied to both. Debate surrounding this misnomer has populated reporting in the area with a bias either side of the true answer.
⚠️ Important — Reuters Investigation
In a 3-year Reuters Special Investigation there was an apparent disconnect between announced chemical recycling capacity and the processing at those sites, while there are concerns that thermochemical processes such as pyrolysis can create dioxins and other hazardous contaminants if feedstock is not properly pre-sorted. In a separate NRDC report places this process in the ‘incineration’ classification for regulatory purposes. Those buyers who have taken sustainable claims on recycled content will need to discern the differences between ‘molecular recycling to virgin-equivalent resin’ and ‘plastic-to-fuel’ before they assign circular economy credit.
However, there is a valid role to play for chemical recycling in streams that cannot be mechanically recycled such as multi-layer flexible packaging, black plastics and degraded streams forerunners that cannot be re-extruded. As central regulatory frameworks like EU PPWR mass-balance accounting standards are set out, the most probable outcome will be a hybrid: clear mono-material streams sent to technology or mechanical recycling, while engineering plastics (nylon, polycarbonate) among others are depolymerised or pyrolysed only as a tail-end added value step. Equipment choices should be made accordingly — see plastic recycling equipment that complements mechanical recycling.
Decision Framework — Recycling Pathway by Plastic Stream
| Stream | Mechanical | Chemical | Compostable Replacement |
|---|---|---|---|
| Mono-material PET bottle, clean | ✅ Primary route | Optional (glycolysis for food-grade) | N/A |
| HDPE rigid (drums, crates, bottles) | ✅ Primary | Rare | N/A |
| Mixed flexible films (multi-layer) | ❌ Limited | ✅ Pyrolysis-to-monomer | Partial — only with composting infrastructure |
| Carbon-black plastics | ❌ NIR sortation fails | ✅ Pyrolysis | Redesign first |
| Single-use foodware | Edge case | ❌ Energy negative | ✅ Where industrial composting exists |
Bioplastics, Compostables, and the Circular Economy: Helpful or Hindrance?

Bioplastics are routinely marketed as the solution to plastic pollution. The reality is more conditional. The category covers three very different things: bio-based plastics derived from renewable feedstocks but functionally identical to fossil-derived counterparts (bio-PE, bio-PET); biodegradable plastics that break down under specific conditions; and compostable plastics that meet certified standards for industrial or home composting. Confusing these categories — or assuming any of them is automatically circular — is the most common misconception in this space.
| Material | End-of-Life Path | Real-World Catch |
|---|---|---|
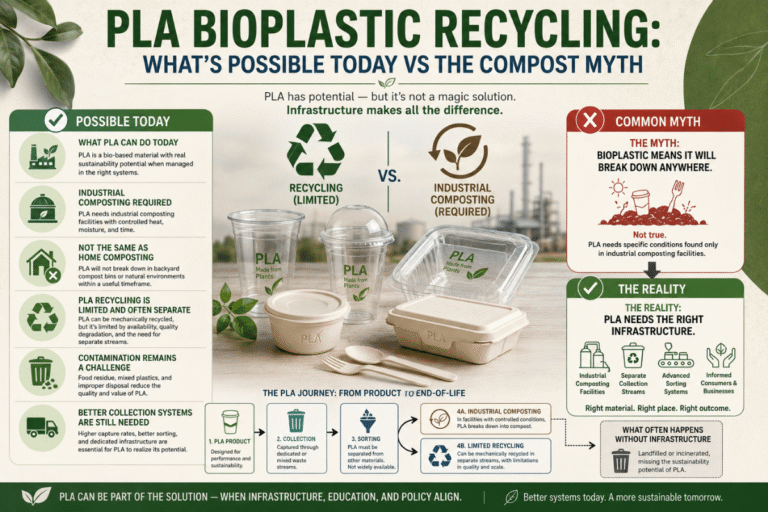
| PLA (polylactic acid) | Industrial composting (~58°C, 12–16 weeks) | Will not break down in home compost or landfill at any meaningful rate |
| PHA (polyhydroxyalkanoates) | Marine and soil biodegradable | Production cost remains 2–3× conventional plastic |
| Bio-PE / Bio-PET | Same as fossil PE/PET — mechanical recycling | Lower carbon footprint upstream, but must enter the same recycling streams to close the loop |
| Oxo-degradable | Fragments into microplastics | Banned in the EU (Single-Use Plastics Directive, 2021); rejected by most circular frameworks |
What Is the Difference Between Biodegradable and Compostable Plastics?
“Biodegradable” only means that microbes can eventually break the substance down — without specifying a time frame or the conditions required. By itself, that claim is not especially useful. “Compostable” is more precise: a compostable plastic must break down into water, CO₂, and biomass within a defined window under specific controlled conditions, certified to standards such as EN 13432 (Europe), ASTM D6400 (US), or BPI certification. Most certified compostable plastics require industrial composting — they will not break down in a backyard pile.
⚠️ The Composting Infrastructure Gap
The Ellen MacArthur Foundation points out that: “Compostable plastic packaging is not a blanket solution, but rather one for specific, targeted applications, because an effective collection and composting infrastructure is essential but often not in place.” Numbers attest to the fact. Industry indicators show that (roughly) 15 percent of U.S. composting facilities even receive compostable plastics, and the Composting Consortium expanded organics collection (for these types of plastics) to around 240,000 U.S. homes over five years – or a sliver of the roughly 130 million. A PLA cup thrown away into a household trash bin wears in a landfill without oxygen or a stable temperature in the same way as a traditional plastic – where biodegradation remains calamitously slow.
The role of bioplastics in the circular economy is real but narrow: short-lived food-contact items in closed venues with industrial composting (stadiums, festivals, catered events), agricultural mulch films where field-decomposable applications make sense, and certain medical applications. For agricultural film recovery as an alternative pathway, see agricultural plastic film recovery and recycling. For most retail packaging, redesign for mechanical recyclability remains the higher-impact move.
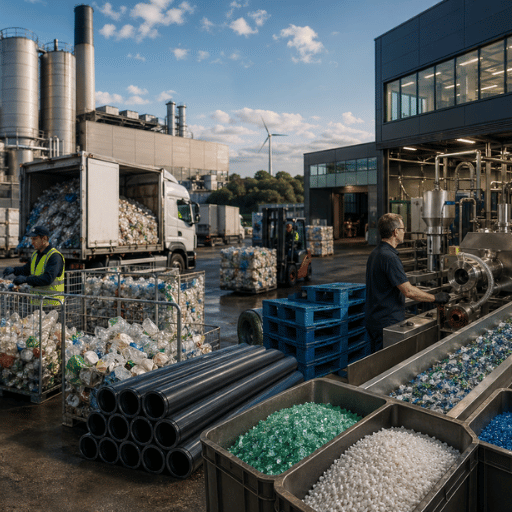
The Equipment Stack: From Single Shredder to Turnkey Recycling Line

A fully circular plastics system runs on hardware. The four steps described above map onto four categories of equipment, each with its own throughput tiers, capital investment ranges, and operator skill requirements. Equipment manufacturers offer them as either standalone machines or integrated turnkey lines.
| Equipment | Typical Capacity | Capital Range |
|---|---|---|
| Plastic shredder (single or twin shaft) | 300–3,000 kg/h | $3,000 – $100,000 |
| Granulator (secondary size reduction) | 200–1,500 kg/h | $5,000 – $50,000 |
| Film washing line | 300–1,000 kg/h | $80,000 – $250,000 |
| PET bottle washing line | 500–3,000 kg/h | $180,000 – $600,000 |
| Pelletizing system | 200–3,000 kg/h | $30,000 – $250,000 |
| Complete turnkey line | 500–3,000 kg/h | $150,000 – $2,000,000+ |
A certain type of equipment purchasing error is neglecting infrastructure. Civil works (foundations, drains), electrical service (rated at 50/60 Hz., voltage considerations), water management, sorting enhancements, spare parts, and skilled worker training tend to total roughly double the equipment list price. Industry guidance is to budget approximately twice the equipment quote for a fully commissioned site.
For brands and processors at the boundary of single-machine upgrades and full-line buildouts, single-source equipment manufacturers reduce integration risk. Kitech engineers complete plastic recycling lines for the circular economy across PET, PE film, agricultural film, rigid plastics, and PP woven bag streams, with CE / UL / CSA certification and 60-day delivery on standard configurations. Tiered equipment specifics are detailed across industrial plastic shredders for recycling, plastic washing systems, and plastic pelletizing equipment pages, with stream-specific configurations such as PET bottle washing lines.
Designing for Circularity: How Packaging Choices Make or Break the Loop

Most plastic that doesn’t get recycled, goes unrecycled at the design stage, not the collection stage. A package that contaminates the PET stream with PVC labels, or uses multi-material laminates impossible to separate, or pigments with carbon black that NIR sortation can’t detect – that package is by definition unrecyclable regardless of the chasing-arrows symbol used. The Association of Plastic Recyclers (APR) addresses this through its APR Design Guide for Plastics Recyclability, now in its 31st year and updated semi annually since December 2025 to keep up with sortation and reprocessing technology.
Five design principles dominate the difference between recyclable on paper versus recyclable in reality:
- ✔
Mono-material construction — one polymer per package wherever possible; eliminate laminates and multi-layer structures that defeat mechanical separation. - ✔
NIR-detectable colors — replace carbon black with detectable alternatives; use dyes, not opaque pigments, where possible. - ✔
Soluble or water-detachable adhesives for labels, so washing can remove labels without destroying flake quality. - ✔
Compatible cap and closure materials — PE/PP caps on PET bottles work because float-sink separation handles them; PVC caps poison the PET stream. - ✔
Minimum recycled content — designing in PCR uptake creates demand for the recycling infrastructure it relies on.
Regulation is driving the design conversation. The EU Packaging and Packaging Waste Regulation (PPWR) mandates that all packaging introduced into the EU market shall be recyclable by 2030 (Article 6) and establishes minimum recycled content levels by category (Article 7) – generally 10% to 35% by 2030 depending on packaging type, climbing even higher by 2040. Brands selling to the EU are already running auditing entire SKU catalogues versus these thresholds because reformulation lead times for packaging often run 18-24 months. For downstream applications, check injection molding with recycled plastic content.
Circular Business Models: EPR, DRS, and Industrial Symbiosis
Technology and design propel us towards a circular plastic economy. The last step is business models and waste management policy that align incentives down the value chain – making producers liable for end-of-life, incentivizing consumers to return packaging, and linking one industry’s waste or side-stream to another’s input stream.
Extended Producer Responsibility (EPR) shifts collection and recycling costs to the producers and brand owners which put packaging on the market. By April 2026, seven US states have passed packaging EPR laws: California (SB 54), Colorado (HB 1355), Maine (LD 1541), Maryland, Minnesota (HF 3577), Oregon (HB 3220), and Washington – with first producer registration deadlines congregating 2025 and 2026. California program is the largest scope plastic single-use program in US, and targets 65% recycling of single-use plastics by 2032 along with source reduction requirements. The EU’s PPWR makes EPR a core requirement across all 27 member states. For operators considering market entry, our guide to starting a plastic recycling business under EPR rules covers the compliance side.
Deposit Return Schemes (DRS) impose a refundable deposit (generally in the range of 0.10-0.25 on eligible beverage containers, which is reclaimed at the point of sale or reverse-vending collection station. The comparative data is astounding: in Germany, the world’s most successful DRS, 98% of eligible containers sold are reclaimed as single-use containers, whereas Norway has a return rate of some where in the mid-90s, and Lithuania was below 34% before DRS was introduced, but moved to over 90% within just a few years. Overall, DRS outperforms curbside-only collection on both volume and feedstock cleanliness because it provides the financial incentive to route material through a centralized return point.
Industrial symbiosis – best exemplified by a number of initiatives run at Denmark’s Kalundborg eco-industrial park – is the use of waste streams from one kind of operation as commercial inputs to another. In plastics terms, compounders find a ready source of rPET from local bottle washing lines, packaging converters learn to use postindustrial scrap from upstream extruders, and chemical recyclers adopt the residual streams mechanical recycling can’t handle. The network of Plastics Pact organizations, led by the Ellen MacArthur Foundation’s New Plastics Economy initiative – which counts more than 1,000 organizations among its members – is a platform for this kind of cross-value-chain coordination.
The Road Ahead for the Plastic Circular Economy: Policy, Technology, and Market Forces 2026–2030
The 2026 baseline for the plastic circular economy is mixed. The UN Plastics Treaty negotiations (INC-5.2) which convened in Geneva in August 2025, resulted in ending without an international legally binding global agreement IUCN described it ending “not with consensus, but with a spark of opportunity”. A legally binding treaty in 2026-2027 remains possible, but uncertain.
In the meantime, three forces are doing the heavy lifting: regional policy, technology maturation, and brand demand for recycled content.
The 5R Plastic Hierarchy — A Decision Order for 2026–2030
- Reduce – remove unnecessary plastics from the design concept and avoid producing any plastics that could cause a problem.
- Redesign — mono-material, NIR-detectable, soluble adhesives, PCR uptake
- Reuse- refilling and returning of single use packaging covering at least 20% of all single-use package ( this means potential value of more than $10B and achieved already by more than 10 industry players according to Ellen MacArthur Foundation)
- Recycle – more first mechanical; chemical (depolymerization) for what mechanical doesn’t work up to it.
- Recover—light/nature/engine room; energy recovery as a controlled tail end, not a primary route.
Policy. EU PPWR Article 7 minimum-recycled-content standards set for 2030. Increased pace of APR semi-annual Design Guide updates leads to earlier brand-to- recycler design input.
The US state EPR rollout continues— at least 10 more states have active legislation efforts, as of early 2026. National USaction is not anticipated without new bipartisan support—but California-like program design is spreading.
Technology. Sorting powered by AI (TOMRA, Greyparrot, AMP Robotics) is reaching MRFs with double digit increases in recovery performance per stream. Mechanical recycling research is focused on the polymer degradation hurdles documented in academic reviews, with additive systems and chainrebuilding efforts that could elevate mechanical pellet quality toward virgin.
Announcements of chemical recycling capacity continue to out number operational capacities; a modest, narrow evolution in depolymerization of PET and certain polyamides, rather than the wide-scale revolution some promotion implied, remains the realistic 2026 2030 outlook.
Market. The global plastics recycling market is expected grow from an estimated $47.9B in 2025 to $67.6B by 2030, while the post-consumer recycled (PCR) plastic packaging market is predicted to reach an estimated value of $87.6B by 2035, at a Compound Annual Growth Rate (CAGR) of 6.3%. For brands, commitments to use 30%+ PCR by 2030 – increasingly mandatorily driven by EPR (Extended Producer Responsibility) legislation – account for much of this demand growth.
The ‘practical’ 2026 for brands is a packaging audit that benchmarks existing packaging against the PPWR Article 6/7 thresholds and the APR Design Guide. For processors and reclaimers, capacity planning aligned to the EPR implementation schedule in high-focus geographies will determine which operators have the feedstock access required over the next ten years.
Frequently Asked Questions About the Plastic Circular Economy
Q: What is the circular economy for plastics in simple terms?
View Answer
A circular economy for plastic is a system where plastic products and packaging are never wasted. Materials are continuously reintroduced into productive use through reuse, recycling or composting, and the system advocates for natural resource improvement rather than depletion. It replaces the era of linear take-make-waste plastics production that emerged circa 1950.
Q: What is the difference between recycling and the circular economy?
View Answer
Recycling is a part of a circular economy, not its entirety. The circular economy is rethought from the start – unnecessary plastics are avoided and designed for reuse, with recycling steps integrated as part of broader strategies. A focus on recycling optimization alone still incurs leakage at each loop and depends on an ongoing resupply of virgin plastic to replace what’s lost.
Q: Are bioplastics part of the circular economy?
View Answer
Conditional. Bio-polymers, like bio-PE or bio-PET, that are compatible with existing mechanical recycling streams can reduce upstream GHG emissions, but still rely on existing infrastructure for recovered plastics. Compostables that are suited to a circular system require industrial composting infrastructure. In the US, only some 15% of composting facilities currently accept biodegradable packaging, so most of this material ends up disposed of in landfill – a context that doesn’t facilitate biodegradation.
Q: Why is only 9% of plastic recycled globally?
View Answer
Three structural conditions are at play. Packaging is mostly designed without consideration for whether or not it is recyclable. Collection infrastructures aren’t widespread – recycling rates among mature EPR schemes in Europe, for instance, reach 26.9%. yet many other countries can’t collect at all. And even what can be collected is often downcycled or contaminated, so it cannot be reused as the same product. All together, these factors tally up to 9% success.
Q: What role do governments play in the plastic circular economy?
View Answer
Governments define the operating framework. EPR legislation requires brands to bear responsibility for end-of-life packaging 7 US states, and the EU, now operate within this model. Deposit schemes can achieve 100% delivery return rates of recyclable content, due to their strong market incentives. National mandates for recycled-content PCR pellets maintain the demand signal necessary to feed recycling capacity into being.
Q: What is fueling the shift towards plastic circularity?
View Answer
Three combined forces. Norms within the EU and US are mandating that linear plastics increase their compliance requirements. Consumer brands are being signed to make PCR pledges that cement the transition to the physical uptake of recycled content. And the economics of material prices are shifting, as virgin prices tighten along the oil cycle while the supply of feedstock in PCR ramps up thanks to EPR incentives.
Explore Plastic Recycling Equipment →
References & Sources
- Plastic pollution is growing relentlessly — OECD Global Plastics Outlook 2022
- Turning off the Tap: How the World Can End Plastic Pollution – UN Environment Programme (UNEP)
- Plastics and the Circular Economy Deep-Dive — Ellen MacArthur Foundation
- The Circular Economy for Plastics – A European Analysis 2024 — Plastics Europe
- Packaging and Packaging Waste Regulation (PPWR) — European Commission
- INC-5.2 Plastic Pollution Negotiations – UN Environment Programme
- APR Design Guide for Plastics Recyclability — Association of Plastic Recyclers
- The Recycling Myth: A Plastic Waste Solution Littered with Failure — Reuters Special Report
- “Chemical Recycling” of Plastic Is Just Greenwashing Incineration – Natural Resources Defense Council
- Overcoming Technical Barriers in Mechanical Recycling of Plastic Waste – ScienceDirect
- A Sustainable Circular Economy of Plastic – Penn State Institute of Energy and the Environment
- Plastics Treaty Negotiations End Without Agreement in Geneva – IUCN
Related Articles
- What Is Recycling? Definition, Process, Types & Benefits — foundational primer on the recycling process
- Plastic Recycling Machine: Types, Selection & Cost Guide — equipment buyer’s perspective on the recycling stack
- PET Bottle Recycling Process Explained — deep-dive on the dominant closed-loop polymer
- Single-Shaft vs Twin-Shaft Shredder Comparison — equipment selection at the size-reduction stage
About This Analysis
This synthesis of data draws from sources including the OECD Global Plastics Outlook, UNEP “Turning Off the Tap” report, Ellen MacArthur Foundation, Plastics Europe Circular Economy Analysis 2024, EU PPWR documentation, US state EPR trackers (April 2026), Reuters investigative reporting, along with literature on mechanical recycling techniques. It has been professionally reviewed by the Kitech Recycling engineering team for equipment-specific accuracy on typical specifications, throughput ranges, and other process parameters. Any third-party industry data referenced is specified in-line with the source in the References & Sources section above, and the equipment specifications shown are based on publicly available manufacturer ranges—representative of a typical industry setup and do not include first-party R&D trial data.