Get in touch with Kitech Company
Plastic Recycling Capacity Planning: A Practical Guide to Sizing Throughput, Equipment, and Plant Footprint
Plastic recycling capacity planning is the practice of translating a target tonnage — daily, monthly, or annual — into the right machine throughput in kg/h, the right line balance from shredder to pelletizer, and the right plant footprint, capex, and crew. Get the math right and a recycling plant turns post-consumer feedstock into pelletized resin profitably. Get it wrong and you either pay for idle steel or push overtime to chase contracts you should never have signed.
Quick Specs: Capacity Planning Reference
| Effective hours/year (single-shift, 70% OEE) | ~1,400 h |
| Effective hours/year (2-shift, 70% OEE) | ~3,000 h |
| Effective hours/year (24/7 industrial, 70% OEE) | ~6,000 h |
| Plastics manufacturing OEE benchmark | 62–75% typical, 78–84% world-class |
| Specific energy, mechanical recycling | ~60–180 kWh per tonne of input |
| Capex range (mechanical) | ~$150,000 (100–300 kg/h) up to $5 M+ (2,000 kg/h+) |
Why Capacity Planning Decides Recycling Plant ROI Before You Buy
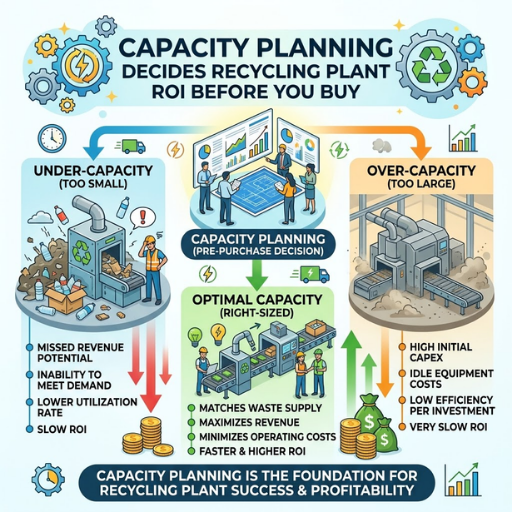
Capacity planning is the first decision that locks in a recycling plant’s profit ceiling. The Association of Plastic Recyclers (APR) reports that more than 85 facilities across the U.S. and Canada already process roughly 5 billion pounds of plastic per year, with headroom to handle another 2 billion pounds — the equivalent of keeping 479 fully loaded 18-wheelers out of landfills every single day, according to a Resource Recycling analysis. Industry-wide, the binding constraint is collection and demand, not equipment. At a single-plant level, the binding constraint is whether you sized your line for the feedstock you can actually secure.
What this guide is NOT.
If you came here for U.S. or global market figures, you will find those macro numbers at the bottom of this article. At its core, however, this guide looks at sizing a line for your plant so the nameplate kg/h actually become profitable tonnes in the warehouse. That involves operational capacity planning, which the macro story of the APR analysis leaves silent.
Three types of failure consistently happen when you go into capacity planning half-baked:
- ⚠️Oversized line. Pelletizer rated 2,000 kg/h, bale yard delivering only 500 kg/h of clean feedstock. Result: 25% utilization and capex that never amortizes — the dominant pattern when buyers chase nameplate capacity instead of sustainable throughput.
- ⚠️Undersized line. Sales signs a 5,000 t/yr offtake before procurement sizes the line. Every shift runs at 95% loading, breakdown frequency triples, quality defects climb, and margins evaporate to overtime and rework.
- ⚠️Mismatched bottleneck. Shredder rated 1,500 kg/h, washer 1,200 kg/h, pelletizer 600 kg/h. Line throughput equals the slowest stage plus surge buffer losses; the other two stages were paid for and never used.
Avoiding these three traps is the entire point of capacity planning. The good news: the math is not difficult — it just has to be done before the purchase order, not after. For the long-term ROI angle (payback, OPEX, contract structure), pair this guide with our breakdown on long-term plastic recycling plant profitability.
Plastic Recycling Capacity Definitions: Throughput, kg/h, t/d, OEE
The first step is to understand the terms without bias. A vendor quote listing “1,000 kg/h capacity” can mean three very different things depending on which definition the seller has in mind. Industry quote sheets are sloppy on this point, so it pays to translate every spec into the same baseline before comparing.
| Term | Definition | Where it shows up |
|---|---|---|
| Nameplate capacity (kg/h) | Maximum throughput on a clean feed, perfect material, instrumented test conditions — what vendors print on the spec sheet. | Vendor quotes, marketing material |
| Effective throughput (kg/h) | Real-world output during a stable production run, accounting for normal feedstock variability and minor stops. Usually 70–90% of nameplate. | Production reports, ERP feeds |
| Daily output (t/d) | Effective throughput × scheduled shift hours, in tonnes (1 t = 1,000 kg). | Daily KPIs, shift reports |
| Annual capacity (t/yr) | Effective throughput × annual operating hours × OEE — this drives offtake contracts and plant ROI. | Business plans, contracts |
| OEE | Overall Equipment Effectiveness — Availability × Performance × Quality. Captures every loss between scheduled time and good output. | Operations dashboards |
What is OEE in a recycling line?
OEE (Overall Equipment Effectiveness) combines three independent loss factors into one number equal to the percentage of a plant’s scheduled production hours that actually end up as good, sellable product. The formula is straightforward: OEE = Availability × Performance × Quality. Availability measures uptime against scheduled hours after planned and unplanned stoppages. Performance compares actual run-rate against the line’s design speed during running time. Quality deducts off-spec material, regrind loops, and pellet rejects.
The OEE industry FAQ notes that the often-cited 85% “world-class” figure was developed for high-volume dedicated lines and is rarely sustained in mixed-feedstock environments. Independent benchmarking data for plastics manufacturing places normal OEE between 62% and 75%, with world-class operations reaching 78–84% — meaning a plant scheduling 24/7 production at 70% OEE converts roughly 6,100 of the year’s 8,760 hours into productive run time. That is the gap between paper capacity and real capacity, and the single largest variable in any capacity plan.
💡 Pro Tip
Always restate vendor quotes in the same units before comparing. Convert lb/hr to kg/h (× 0.4536), and never accept a quote that lists only “capacity” without specifying nameplate vs. effective. A 10–30% silent gap between those two numbers will distort every downstream decision.
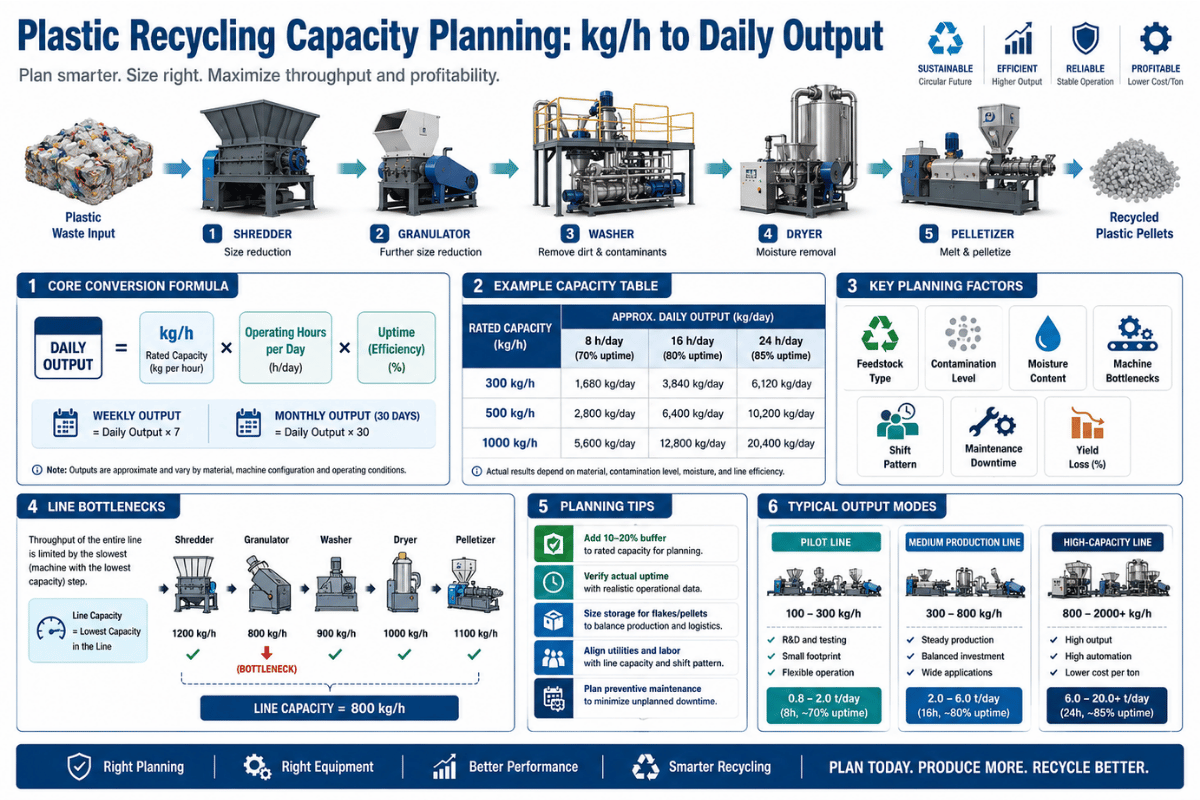
How to Convert kg/h to Daily, Monthly, and Annual Output
Converting kg/h on a nameplate to t/yr on a contract takes one multiplication, one division, and one realism check. That realism check separates contracts that get fulfilled from contracts that strand inventory. Here is the math:
Annual Capacity Formula
Annual t/yr = Nameplate kg/h × Effective Hours per Year × OEE ÷ 1,000
Where Effective Hours per Year = Scheduled Hours × (1 − planned downtime fraction), and OEE captures availability, performance, and quality losses on top of scheduled time.
| Nameplate | Single-shift (~1,400 h/yr) | 2-shift (~3,000 h/yr) | 24/7 industrial (~6,000 h/yr) |
|---|---|---|---|
| 500 kg/h | ~700 t/yr | ~1,500 t/yr | ~3,000 t/yr |
| 1,000 kg/h | ~1,400 t/yr | ~3,000 t/yr | ~6,000 t/yr |
| 2,000 kg/h | ~2,800 t/yr | ~6,000 t/yr | ~12,000 t/yr |
The numbers above already absorb a 70% OEE on the scheduled hours. What you should never do is multiply nameplate kg/h by 8,760 — the result is a fantasy plant that runs full speed 24/7 with zero changeovers, zero breakdowns, zero quality holds. Plant operators commonly report that buyers who sign offtake against the 8,760 calculation later have to renegotiate or import virgin pellets to fill the gap.
⚡ The 6,000-Hour Industrial Rule
For a recycling plant scheduled 24/7 with healthy OEE (~70%), a useful first-pass heuristic is:
Realistic annual tonnes ≈ kg/h × 6,000 ÷ 1,000
A 500 kg/h pelletizer at 24/7 industrial pace lands near 3,000 t/yr. A 1,000 kg/h line lands near 6,000 t/yr. A 2,000 kg/h line lands near 12,000 t/yr. Adjust the multiplier for the actual shift pattern: ~3,000 for 2-shift, ~1,400 for single-shift, ~4,500 for 24/5 three-shift.
The number you should never use is 8,760 × nameplate. It assumes zero downtime, which no recycling line on earth achieves.
📐 Engineering Notekg/h and lb/hr are not interchangeable. 1 kg/h = 2.2046 lb/hr, so a vendor advertising “1,000 lb/hr” is offering 454 kg/h, not 1,000 kg/h. When comparing a Chinese-built unit rated 1,000 kg/h against a U.S.-built unit rated 1,000 lb/hr, the metric-rated unit delivers 2.2× the throughput. Always restate quotes in a single unit system before signing.
How do you calculate plastic recycling capacity?
Calculating plastic recycling capacity is a four-step worked sequence:
- Confirm nameplate kg/h with the vendor in writing, in metric units, on your specific feedstock — not on factory test material.
- Choose your shift pattern and translate it to scheduled hours per year. A common industrial reference: single-shift ≈ 2,000 h, 2-shift ≈ 4,000 h, 24/5 three-shift ≈ 6,000 h, 24/7 = 8,760 h.
- Apply an OEE multiplier based on operational maturity: 0.65 for a new plant in year one, 0.70 for established operations, 0.78+ for world-class. Most plants sit at 0.65–0.72 in the first three years.
- Multiply and divide: Annual t/yr = kg/h × Scheduled Hours × OEE ÷ 1,000. Compare the result to your offtake contract obligations. If it does not exceed contracted volume by at least 15%, you are buying too small.
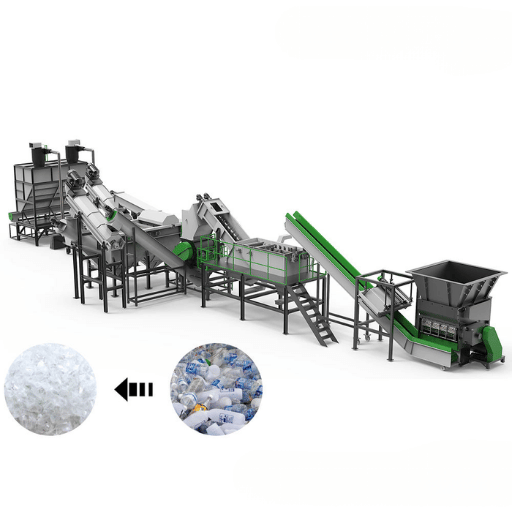
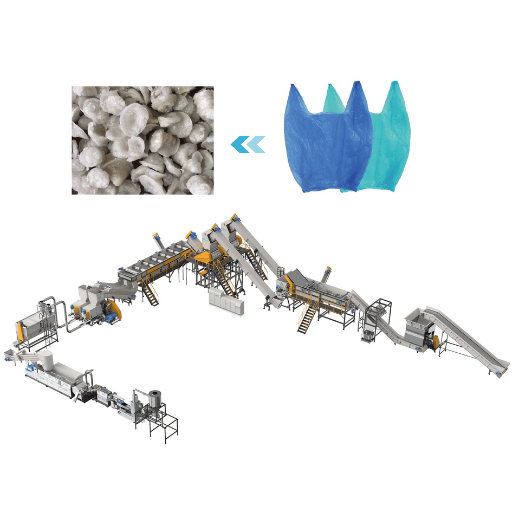
Equipment Selection by Material Type
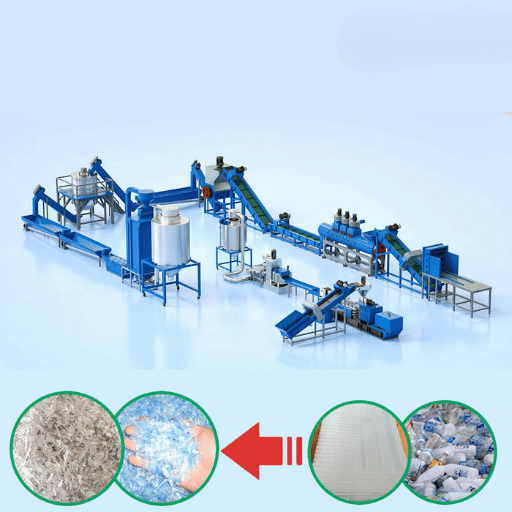
The same shredder–washer–pelletizer line delivers very different kg/h depending on whether it is processing PET bottles, HDPE drums, PP woven bags, or LDPE film. Bulk density, contamination, moisture, and material toughness each shift the throughput curve. Equipment selection by material type is therefore inseparable from capacity planning — the kg/h figure on a quote sheet is meaningful only when paired with the resin it was measured against.
Below, this matrix summarizes typical effective throughput ranges across the three core line stages, indexed to common feedstock types. Use it to sanity-check vendor quotes against the resin you actually intend to process.
| Material | Shredder kg/h (typical) | Washer kg/h (typical) | Pelletizer kg/h (typical) | Yield (input → pellet) |
|---|---|---|---|---|
| PET bottles (post-consumer) | 800–2,500 | 600–2,000 | 500–1,800 | ~70–80% |
| HDPE drums / milk bottles | 600–2,000 | 500–1,800 | 450–1,500 | ~80–88% |
| PP woven bags | 400–1,200 | 350–1,100 | 300–1,000 | ~75–85% |
| LDPE / agricultural film | 300–1,000 | 300–900 | 250–800 | ~60–75% (high contamination loss) |
| Rigid mixed plastics | 700–2,200 | 500–1,800 | 400–1,500 | ~70–82% |
Three practical consequences fall out of this matrix:
- Film and woven materials run slower than rigid feedstock on every stage. A line sized for HDPE drums will under-deliver by 30–40% on PP woven bags. Plan around the slowest material in your mix.
- PET yield is lower than HDPE yield because of wash-loss from labels, glue, and residual liquids. A 1,000 kg/h PET washing line usually produces 700–800 kg/h of clean flake.
- Mixed-material lines force you to size for the bottleneck material. If 70% of your feedstock is HDPE and 30% is film, the line capacity is set by film throughput, not by the average.
For deeper material-specific guidance, see our standalone breakdowns of PET bottle washing line specifications and the rigid plastic recycling line configurations. To match a specific feedstock and target output to a recommended line size, use Kitech’s free capacity planner — it walks through the same math above with your actual numbers.
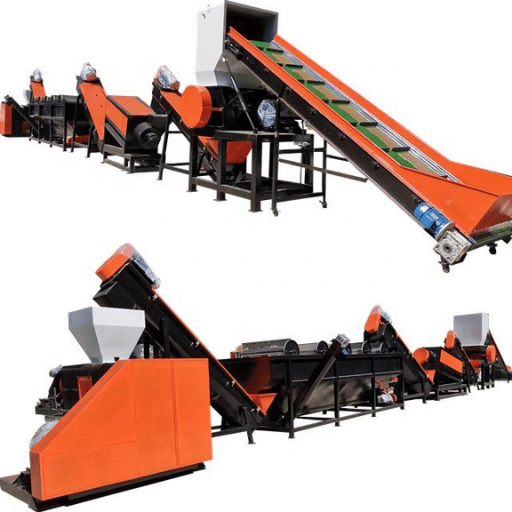
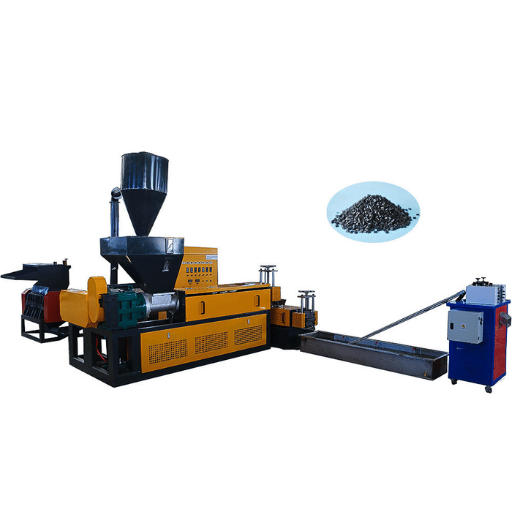
Sizing the Bottleneck: Shredder → Washer → Dryer → Pelletizer Balance
A recycling line’s throughput equals the throughput of its slowest stage, minus the buffer losses between stages. That is the bottleneck rule, and it is the second most violated principle in capacity planning after the 8,760-hour mistake.
Picture a four-stage line:
Shredder 1,500 kg/h → Washer 1,200 kg/h → Dryer 1,000 kg/h → Pelletizer 600 kg/h
Line throughput here is 600 kg/h, set by the pelletizer. Those upstream stages — shredder, washer, dryer — were paid for, take up floor space, draw electricity in standby, and contribute exactly zero additional kg/h above the pelletizer ceiling. That is roughly $200,000 to $400,000 of capex earning nothing. Only two fixes work: upsize the pelletizer, or downsize the upstream stages so they run continuously instead of cycling on and off.
Industry’s working rule for line balance: size each upstream stage at 1.3× to 1.5× the throughput of the next stage. That extra headroom absorbs surge buffering, feed variability, and short stops without starving the bottleneck. So a 600 kg/h pelletizer wants a dryer rated 800–900 kg/h, a washer rated 1,000–1,200 kg/h, and a shredder rated 1,200–1,500 kg/h. Anything more is wasted; anything less and the bottleneck moves upstream.
“Plastics recycling works—when the whole system is designed to work with it. That’s not a slogan. It’s a fact supported by data and by stories from the companies and communities that comprise plastics recycling value chain.”
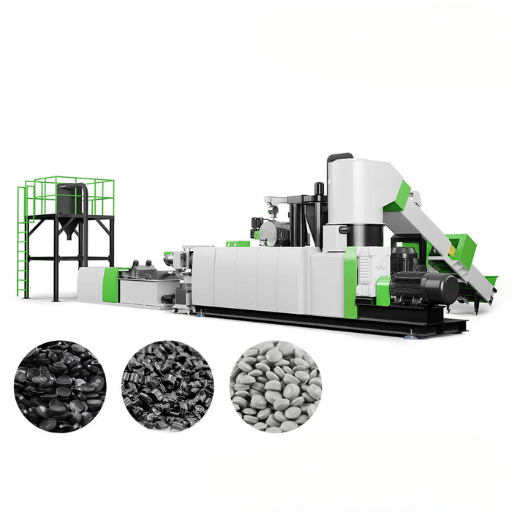
Pelletizers tend to be the throughput-limiting stage in mechanical recycling lines because the extruder must keep pellet quality stable under variable feed moisture, contamination, and bulk density. Industry monitoring data published by Guidewheel indicates extruder downtime events average 209 minutes apiece, accumulating to roughly 280 hours per year per line — a number that rolls straight into a plant’s OEE deficit.
⚠️ Important
Self-cleaning melt filtration adds 5–15% throughput uplift on contaminated feedstock by reducing changeover stops. For lines processing film, post-consumer rigid plastic, or mixed bales, factor this into the bottleneck math — see our overview of the auto self-cleaning laser filtration system for typical uplift ranges by material type.
Upstream choices also influence the bottleneck. A single-shaft shredder is forgiving on inconsistent bale quality but plateaus around 2,000 kg/h on rigid materials; a twin-shaft handles tougher feed at lower kg/h per axis. This trade-off matters because the wrong upstream choice can starve the pelletizer even when the per-stage nameplate looks adequate. Our deep dive on single-shaft versus twin-shaft shredder selection details the throughput differences.
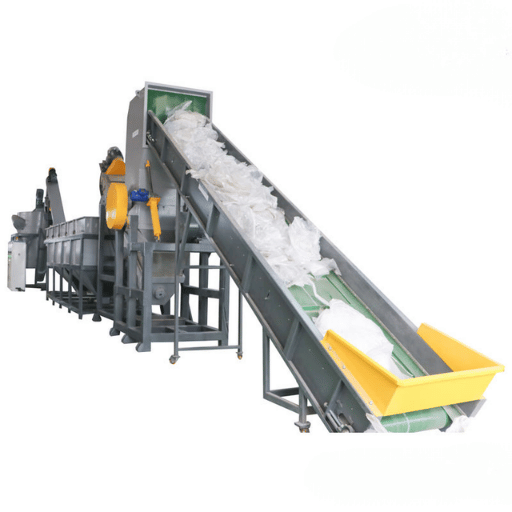
Specific Energy, Water, and Labor Loads per Tonne
Capacity planning that stops at kg/h ignores the operating cost side of the same equation. A 1,000 kg/h line that consumes 200 kWh per tonne is structurally less profitable than one that consumes 80 kWh per tonne, even when both deliver identical pellet output. The European Commission’s Joint Research Centre estimated average electricity consumption around 61.1 kWh per tonne of input waste for plastic granulators, based on the specific demand of multiple granulator models, in its Environmental and Economic Assessment of Plastic Waste Recycling report. That is the granulator alone — a full mechanical line including washing, drying, extrusion, and pelletizing usually lands in the 100–180 kWh/tonne range for clean PET/HDPE feedstocks, and higher for film and contaminated rigids.
~61 kWh/t
Granulator only (EU JRC)
100–180 kWh/t
Full mechanical line, clean feed
3–6 m³/t
Wash water (PET bottle line)
6–12 staff
Per shift, 1,000 kg/h line
| Stage | Electricity (kWh/t) | Water (m³/t) | Labor (operators/shift) |
|---|---|---|---|
| Shredding / granulating | 40–80 | ~0 | 1–2 (feeder + monitoring) |
| Washing | 15–35 | 3–6 | 2–3 (sorting + wash control) |
| Drying / dewatering | 15–30 | ~0 | 1 (shared) |
| Pelletizing / extrusion | 30–60 | ~0.2 (cooling) | 2–3 (extruder + bagging) |
One mistake worth flagging: plan OPEX on effective output, not nameplate kg/h. If you run at 70% OEE, your kWh/t and labor/t figures are 1/0.7=1.43 higher than the textbook equation suggests, because fixed loads (lighting, HVAC, control system, idling equipment) are consuming electricity during idle periods. Always normalize OPEX per actual tonne shipped, not per nameplate hour scheduled.
Translating Capacity Into Plant Footprint, Capex, and Workforce
A capacity number on its own is incomplete. Investors, lenders, and zoning officials care about the physical footprint, the capex tier, and the headcount that the kg/h target implies. The peer-reviewed Wiley analysis of plastic recycling plant capital investment confirms that total capex correlates strongly with plant capacity (and with energy loss), supporting the standard ballpark approach of planning by capacity tier rather than line-itemizing every machine on day one.
Below, four tiers summarize the capacity, footprint, capex, and crew profile of mechanical recycling plants in 2025–2026 ranges. Treat the figures as orientation, not a quote — actual costs vary by region, automation level, and ancillary infrastructure (rail siding, water treatment, baler integration).
| Tier | Capacity (kg/h) | Annual (t/yr, 24/7 OEE 70%) | Footprint (m²) | Capex range (USD) | Crew (2-shift) |
|---|---|---|---|---|---|
| Micro | 100–300 | 600–1,800 | 300–600 | $150K – $400K | 4–6 |
| Small | 300–800 | 1,800–4,800 | 600–1,500 | $400K – $1.2 M | 8–12 |
| Medium | 800–2,000 | 4,800–12,000 | 1,500–3,500 | $1.2 M – $3 M | 14–22 |
| Large industrial | 2,000–5,000+ | 12,000–30,000+ | 3,500–8,000+ | $3 M – $10 M+ | 25–45 |
Two patterns emerge across the tiers. First, capex per kg/h falls sharply with scale — a micro plant pays roughly $1,000–$1,300 per kg/h of installed capacity, while a large industrial plant pays $1,500–$2,000 per kg/h on a higher absolute base, with substantially more automation, higher OEE potential, and lower per-tonne OPEX. Second, crew density also drops with scale: a micro plant runs ~5 staff per 200 kg/h (1 person per 40 kg/h), while a large industrial plant runs ~35 staff per 3,000 kg/h (1 per 85 kg/h). For a full breakdown of capex line items by stage, our 2026 plant cost guide drills into the components.
Decision Framework: Match Tier to Feedstock Reality
- If your secured feedstock is <1,500 t/yr with no expansion path → Micro tier.
- If feedstock is 1,500–4,500 t/yr with offtake confirmed → Small tier.
- If feedstock is 5,000–12,000 t/yr with multi-year contracts → Medium tier.
- If >12,000 t/yr feedstock + EPR-driven demand outlook + integrated MRF supply → Large industrial tier.
Sizing one tier above your secured feedstock is the most common — and most expensive — capacity planning mistake.
5 Common Capacity Planning Mistakes (and How to Avoid Them)
Patterns repeat across new entrants, plant expansions, and equipment retrofits. Five patterns below account for most failed capacity decisions in the mechanical recycling space.
⚠️ Mistake 1: Buying nameplate capacity
Vendor nameplates are measured under controlled conditions on clean feedstock. Real production deducts changeover, contamination, downtime, and quality loss. Always plan against effective throughput at 65–75% of nameplate, not the headline number.
⚠️ Mistake 2: Ignoring downtime in the OEE multiplier
A plant scheduled to operate 8,760 hours but recording 6,100 productive hours achieves a 70% OEE — a normal figure for plastics manufacturing. Those 2,660 missing hours are not an optional data point. Factor them into your annual capacity target from day one.
⚠️ Mistake 3: Oversizing the shredder relative to the pelletizer
A 2,000 kg/h shredder feeding a 600 kg/h pelletizer wastes capex and floor space. Shredders cycle on and off in this scenario, accelerating wear, raising power draw, and contributing nothing to line throughput. Size upstream stages at 1.3–1.5× the bottleneck — no more.
⚠️ Mistake 4: Skipping the bottleneck audit before commissioning
Many integrators sell a “balanced line” without verifying balance against the buyer’s actual feedstock mix. Plant operators frequently report that the as-built bottleneck is not the as-designed bottleneck. Walk the line, take per-stage time studies during the first 30 days, and rebalance before signing acceptance. For shredder-vs-granulator selection at the upstream end, see our breakdown of shredder versus granulator selection.
⚠️ Mistake 5: No future-proofing for EPR-driven feedstock growth
As EPR programs go live in Oregon (2025), Colorado (June 2026), and additional states, post-consumer feedstock volumes will rise. A line sized exactly to today’s feedstock has no headroom to capture that growth. Build with at least 20% expansion capacity in floor space, electrical service, and water treatment.
Where North American Plastic Recycling Capacity Stands in 2025
The macro context matters because it shapes feedstock pricing, offtake demand, and the regulatory backdrop against which any new plant operates. The headline figure is well documented: roughly 85 mechanical recycling facilities in the U.S. and Canada have the technical capacity to recycle 7 billion pounds of plastic packaging annually, of which about 5 billion pounds were processed in 2022 according to the latest published figures. Remaining headroom of 2 billion pounds — equivalent to 479 truckloads per day — sits across PET, HDPE, polypropylene, and film.
The interpretation comes directly from APR’s leadership: this is not a capacity issue, it is a market and collection issue. Mechanical recyclers across North America operate below their installed capacity not because they cannot process more, but because the upstream recycling rate and downstream demand for post-consumer recycled (PCR) content do not yet support full utilization. Lifting U.S. household recycling rates by even a few percentage points would absorb a meaningful share of the 2 billion pounds of headroom currently sitting idle.
Mechanical Recycling (North America)
- ~85 reclaiming facilities (U.S. + Canada)
- ~5 billion lbs processed in 2022
- ~2 billion lbs additional capacity available
- Spare capacity exists across PET, HDPE, PP, film
Chemical / Advanced Recycling
- ~1 million metric tons global capacity in 2023
- Projected ~5 million metric tons by 2030 (IFC 2025 outlook)
- Adds capacity for hard-to-recycle streams (mixed films, multilayers)
- Mass-balance accounting enabling food-grade applications
The international picture is sharply different. Plastics Recyclers Europe reported that roughly 300,000 tonnes per year of mechanical recycling capacity closed in 2024 — half of it in the UK and the Netherlands — with similar losses anticipated in 2025, according to Chemistry World’s analysis. The trigger: cheap virgin polymer driven by Chinese petrochemical capacity expansion, combined with high European energy costs and policy uncertainty. Europe and North America are running the same capacity-versus-demand equation in opposite directions, and a buyer planning a new line in either market needs to read the macro context accordingly. The Pew “Breaking the Plastic Wave 2025” assessment frames the underlying systemic dynamics that drive both sides of this divergence.
Industry Outlook 2026: EPR Mandates, Recycled-Content Targets, Capacity Investment
Three converging policy and market shifts will redefine plant-level capacity planning over the 2026–2030 window. Buyers planning capex today should price these into their tier decisions.
EPR Goes Live
Oregon’s EPR program launched in 2025, Colorado’s begins June 2026, with additional states following. EPR fees flow back to processors, raising sustained PCR demand and strengthening offtake economics for mechanical recyclers.
Recycled-Content Mandates
EU’s PPWR sets recycled content trajectories of 10–35% by 2030 and 25–65% by 2040 depending on polymer and application. ICIS forecasts EU PPWR demand at 5.4 million tonnes/yr by 2030, rising to 11.5 million tonnes/yr by 2040 — capacity additions on both sides of the Atlantic will follow.
CIRCLE Act & Investment Tax Credit
The bipartisan U.S. CIRCLE Act (introduced July 2025) proposes a 30% investment tax credit for qualifying recycling infrastructure. Industry analysis projects up to $30 billion in economic benefit and 200,000 jobs if enacted — a direct subsidy to capacity expansion.
Buyer Takeaway for 2026 Capacity Decisions
If you are sizing a plant for 2026 commissioning, plan for feedstock volumes 15–25% higher than today’s secured supply. EPR-driven collection growth, plus recycled-content mandate pull, should arrive on the same 18–36 month horizon as your equipment lead times. Build the floor space, electrical service, and water treatment capacity for that growth. Expansion later costs roughly 2–3× provisioning at build.
FAQ
Q: How is plastic recycling capacity measured?
View Answer
Plastic recycling capacity is measured in three units: kg/h (instantaneous throughput), t/d (daily output, typically 8–24 hours of run time), and t/yr (annual capacity, scheduled hours × OEE). A vendor specification in kg/h is a nameplate figure under ideal test conditions; the t/yr derived from it after applying OEE and shift pattern is what you should plan against.
Q: What is a realistic uptime percentage for a plastic recycling line?
View Answer
Independent benchmarking puts plastics manufacturing OEE at 62–75% typical and 78–84% world-class. New plants in their first year usually land at the lower end of typical (~65%); established mechanical recycling lines stabilize around 70–72% after year three. Aim for 70% in capacity planning unless you have specific evidence to use a higher or lower figure.
Q: How much electricity does a plastic recycling plant use per tonne?
View Answer
A full mechanical recycling line consumes roughly 100–180 kWh per tonne of input on clean PET or HDPE feedstock. Granulators alone average around 61 kWh/tonne per EU JRC data; washing adds 15–35 kWh/t, drying 15–30, pelletizing 30–60. Film and contaminated rigid feedstocks push the total higher.
Q: What is the minimum viable capacity for a profitable plastic recycling business?
View Answer
Profitable thresholds depend on resin type, regional energy and labor costs, and offtake pricing, but a useful floor is roughly 800–1,500 t/yr of clean pellet output — corresponding to a 300–500 kg/h line operating 2-shift at ~70% OEE. Below that, fixed costs (utilities, labor, lab QC, regulatory compliance) are difficult to spread thinly enough to clear margin.
Q: How long does it take to commission a 1,000 kg/h plastic recycling line?
View Answer
From purchase order to commercial production, a 1,000 kg/h mechanical line usually takes 6–10 months: 3–5 months for equipment manufacture and shipping, 1–2 months for installation, 1–2 months for commissioning and operator training, and 1 month of stabilization before the line hits design throughput. Plants commissioning multiple stages in parallel can compress this; greenfield sites with civil works extend it to 12–18 months.
Q: Should I plan capacity for one material or multiple materials?
View Answer
Single-material lines achieve higher throughput, higher OEE, and better pellet quality because the equipment is optimized for one feedstock. Multi-material lines accept feedstock flexibility at the cost of changeover losses (1–4 hours per material switch) and lower per-material yield. As a rule of thumb: dedicated single-material if your feedstock supply is reliable; multi-material if you cannot secure stable single-resin contracts.
Q: Where does excess North American recycling capacity actually exist?
View Answer
APR’s 2025 capacity report identifies spare capacity across all major resin streams in the U.S. and Canada — PET, HDPE, polypropylene, and film. Most acute spare capacity sits in HDPE and PP rigid streams, where existing plants can absorb substantially more bale supply if collection rates rise. Film recycling capacity is more constrained because of contamination challenges.
References & Sources
- Plastics Recycling Capacity Across US and Canada (Oct 2025) — Association of Plastic Recyclers (APR)
- Plastics Recyclers Have the Capacity to Recycle More. Now Let’s Use It (Sept 2025) — Resource Recycling Magazine, Steve Alexander, APR
- Plastic recycling is contracting when it needs to grow (Jan 2026) — Chemistry World, Royal Society of Chemistry
- The Run on Recycled Plastic (2025) — International Finance Corporation, World Bank Group
- Environmental and Economic Assessment of Plastic Waste Recycling (PDF) — European Commission Joint Research Centre
- Total Capital Investment of plastic recycling plants correlates with capacity — Wiley ChemSusChem (peer-reviewed)
- Breaking the Plastic Wave 2025 — The Pew Charitable Trusts
- OEE FAQ — OEE Industry Standards
- Extruder Monitoring: Reducing Downtime in Plastics Packaging — Guidewheel Performance Analysis
Related Articles
- Plastic Recycling Machine: Types, Selection & Cost Guide — pillar overview of equipment families and selection criteria
- Plastic Pelletizing Line specifications — downstream pelletizer configuration and throughput
- HDPE Recycling Line — material-specific line configuration for HDPE drums and milk bottles
- PET Recycling Complete Guide — PET-specific washing line throughput and yield
- Pelletizer system sizer (interactive tool) — match feedstock and target output to a recommended pelletizer model
Our Perspective on Capacity Planning
Throughput tables and tier matrices in this guide reflect what we see across PET, HDPE, polypropylene, and film line installations — the resin streams Kitech engineers integrate every month. Our “6,000-Hour Industrial Rule” is not a published industry standard; it is a heuristic we’ve found useful as a first-pass sanity check on offtake contracts before vendors and buyers spend three weeks negotiating around the wrong number.
Reviewed by Kitech engineering team — specialists in PET, HDPE, PP, and film plastic recycling line integration.