Get in touch with Kitech Company


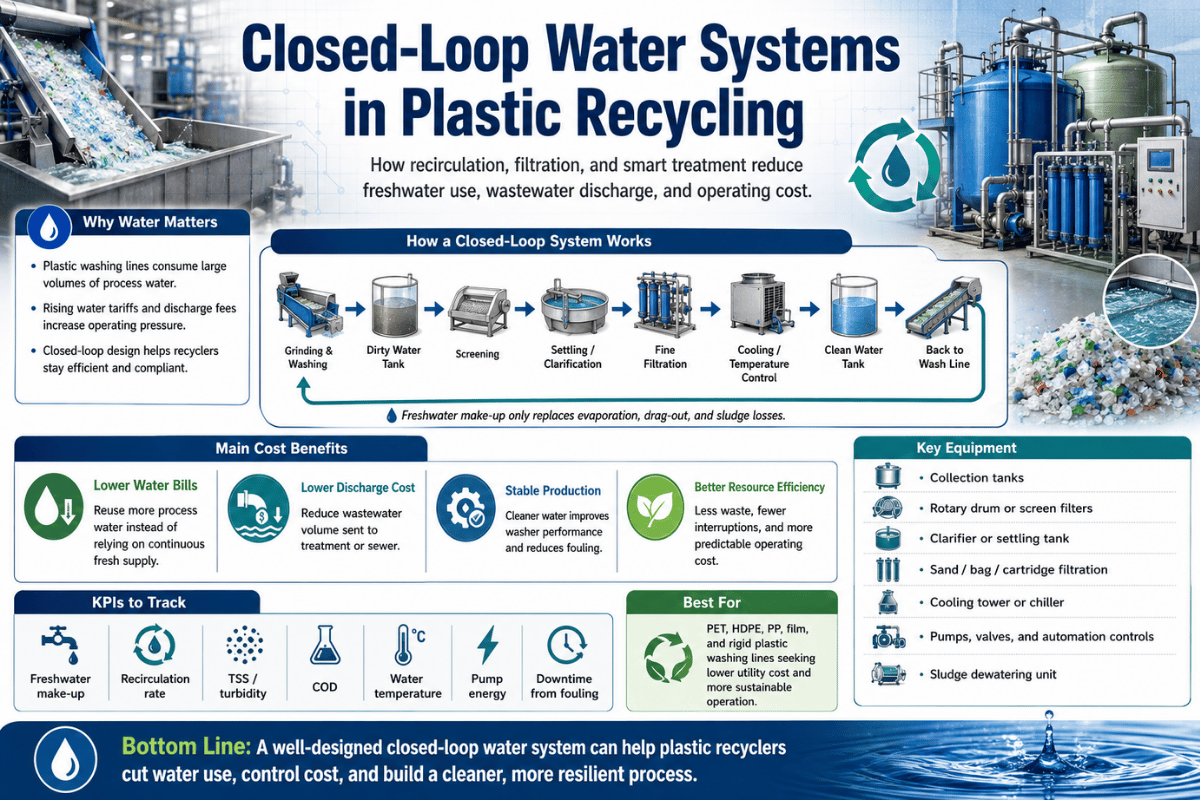
A closed-loop water recycling system dictates whether a plastic washing plant either manages its running costs, or is dictated by them. At a typical rigid plastic line running 1,000 kg/h, open loop operation involves a throughput of 8-15 tonnes/hour fresh water. A properly designed closed-loop system drops this to ²-3 t/h makeup – a 4-6× reduction, which often pays back capex within months. Water consumption is more than a cost – it’s compliance exposure and flake quality variable.
This guide describes treatment train components, how to size them for LDW, RPW and WES lines, what environmental compliance requires and what zero discharge realistically looks like.
Quick Specs: Closed-Loop Water System for Plastic Recycling
| Makeup water — closed-loop | 2–3 t/h per 1,000 kg/h washing capacity |
| Water consumption — open-loop | 8–15 t/h per 1,000 kg/h |
| Target TSS for recirculation | <200 mg/L (general); <50 mg/L (hot rinse stage) |
| pH operating range | 6.5–8.5 (recirculated water) |
| Blowdown rate | 5–15% of circulating volume per day |
| Sludge production estimate | 0.5–2% of daily wash water volume |
| Typical water treatment capex | $20,000–$80,000 (capacity-dependent) |
Benefits of a Closed-Loop Water Recycling System for Plastic Recycling Plants
Water is the primary process medium in plastic washing operations. Film lines, rigid plastic lines and pet bottle lines rely on water as a primary medium for sorting impurities -labels, chemical residue, glue and dirt -from recycled flake. The impact of closed loop water treatment is threefold, making it an obvious choice for facilities handling over 500kg/h.
Water Efficiency. Figures show that the Kitech RPW1000 open loop line consumes 8-15 t/h of makeup water, whereas a closed-loop recycling system reduces the amount of water consumed by 4–6× (to 2–3 t/h makeup) at 1,000 kg/h processing capacity. Working 16 hours a day, 300 days a year, this equates to 35,000-55,000 fewer tonnes of water used each year and cuts costs related to water usage and municipal charges substantially.
Flake Quality. As recirculated water that isn’t treated gets loaded with impurities, at a level of around 300-400 mg/L total suspended solids, this inevitably results in redepositation onto washed clean surfaces. This causes contamination of fresh plastic flakes and a drop in purity after flake is dried – to between 3-8%. The risk for food-grade plastic is more acute due to tighter purity criteria, which often fall well below 100 ppm.
Regulatory Compliance. If you’re using a line that discharges into surface water (including municipal drains), you will need to secure an NPDES permit from the EPA (Environmental Protection Agency) in the US under the Industrial Wastewater program. An indirect discharger to a municipal water system may also fall under local Industrial Pretreatment Program (IPP) requirements. Because it’s a circular system that minimises discharges, a properly managed closed-loop process will minimise your overall exposure. And, in a US EPA compliant zero-discharge scenario, wastewater that has been reclaimed and returned to the process may be excluded from RCRA hazardous waste generation regulations (see 40 CFR 261.4(a)(8) of AZDEQ for guidance).
Delayed action on water management investment often leads to the discovery of water management challenges – most commonly discovered at the initial quality audit by a new customer, at which point the water will have likely been circulating and deteriorating in quality for some time. See plastic washing line water consumption benchmarks to find data comparable across different types of processing lines.
4–6×
Less water vs open-loop
97%+
Flake purity with managed water quality
<3 yr
Typical capex payback at $0.50+/m³
Process Water Contaminants in Plastic Washing: What Drives Treatment Design
Before Equipment Proposal: the Wash Test – Your “One Wild Card” for the Wastewater Game The Four Categories of Contaminants in Your plastic Wash Water: “Which Batch Did We Run?” Water Quality in plastic recycling Plants varies greatly, with concentrations of contaminants potentially fluctuating between “3-5-Fold.” So When requesting an equipment proposal from wastewater technology vendors, what if you don’t know exactly how the influent quality at your facility differs?
Quotes for what appear to be very similar systems can vary wildly based on what the vendor “assumes” to be the quality of your water supply. “If the lab analysis of their wash water is an unknown, vendor wastewater equipment quotes often come with a standard risk premium, resulting in bids being as much as 3 to 5 times higher,” writes Dave Johnson, an expert in industrial water and wastewater treatment systems and author of the guide to plastic wash water treatment. “A relatively cheap 500 ml sample can Prevent a costly redesign.” Before ordering estimates for your plastic wash water system, run a thorough analysis of your wash water – and send that data along to your potential vendors.
Plastic wash water treatment works by targeting four general categories of contaminants, but concentrations for each group can vary 3-5 fold depending on the exact feedstock: • Heavy solids (grit, glass, sand) are greater than 2 mm in size, and must be removed to protect pump and DAF (Dissolved Air Flotation) diffuser elements from damage.
• Suspended solids (label fibers, plastic fines) are smaller than 2mm and will not settle by gravity alone – a coagulant and DAF is needed to remove them.
• Oils and organics (food residue, adhesives, detergent carry-over) need chemical treatment and a physical method to lift them from the water.
• Caustic carryover is unique to caustic-based hot wash lines and can interfere with coagulant chemistry.
- Heavy solids: Grit, glass, sand, and aggregate from shredding post-consumer rigid plastic. Film feedstock from agricultural use carries soil and gravel.Particles above 2 mm must be removed before reaching pumps and DAF diffuser internals.
- Suspended solids: Paper label fibers, microplastic fines, and adhesive polymer particles from label removal – typically 10-500 m.These are too light for gravity settling alone. DAF with chemical pre-treatment is required.
- Oils and organics: Food residue in post-consumer HDPE/PP containers, adhesive polymer from label stock, and surfactant carryover from hot wash detergent dosing.
- Chemical load: Hot wash operating at 80-95C with 1-2% NaOH generates alkaline discharge at pH 9-11 in the first water contact cycle.Without pH management, caustic carryover accumulates in the recirculation loop and eventually inhibits the coagulation chemistry that DAF depends on. Hot wash lines that use caustic require dedicated pH neutralisation in Zone 4. See also our overview of hot wash systems and their caustic carryover treatment requirements.
| Parameter | Typical Range | What It Indicates | Design Trigger |
|---|---|---|---|
| TSS | 200–2,000 mg/L (raw) | Suspended solid load on DAF | >500 mg/L → Zone 1 + Zone 2 mandatory |
| Oil & Grease | 10–200 mg/L | Chemical coagulant demand | >50 mg/L → chemical pre-treatment required |
| pH | 6.0–11.0 (feedstock-dependent) | Hot wash carryover; coagulant compatibility | Hot wash lines → Zone 4 pH neutralisation required |
| Temperature | 20–60°C | Flocculation speed; DAF air solubility | >45°C → cooling stage before DAF recommended |
| Conductivity / TDS | 500–3,000 µS/cm (builds with cycles) | Dissolved solids accumulation rate | >2,000 µS/cm → increase blowdown frequency |
What parameters should I test in plastic wash water before designing a treatment system?
At minimum: TSS, oil and grease, pH, temperature, and conductivity/TDS. Label each sample with feedstock type, wash stage, and wash chemicals in use.
If you process multiple feedstock types, collect a sample for each. Collect samples during normal production – not during start-up or shutdown, when contamination profiles are unrepresentative. A composite sample taken over four hours of normal operation provides far more representative data than a grab sample.
Vendors designing from untested assumptions will specify for the wrong treatment train; a $500 lab test prevents a $30,000 redesign.
The 4-Zone Treatment Train for Plastic Recycling Wash Water
Our 4-Zone Treatment Train Architecture for Plastic Recycling Plants
A structured framework for evaluating vendor proposals and designing plastic wash water treatment. Unlike general industrial water treatment approaches, this architecture sequences treatment zones to match the specific contamination profile and flow variability of post-consumer plastic washing operations – where contamination can swing 3-5 within a single hour based on feedstock batch changes.
Every closed loop water treatment system for plastics requires four sequenced zones, each addressing a distinct contamination type and failure mode. Skipping or undersizing any zone tends to create compounding problems downstream – usually at higher cost than the original saving.
Zone 1 — Primary Protection (Coarse Screening)
Equipment: Drum screen, vibrating screen, or trommel; grit channel or settling pit; inline separator for heavy grit and dense particles upstream of pumps.
Goal: Remove particles >2 mm before they reach pumps and DAF diffuser plates.
Grit generated from plastic shredding operations is the primary target here.
Failure mode: Grit passing Zone 1 screen enters DAF diffuser plates. Noted by plant engineers, abrasive grit drastically reduces diffuser longevity from 3-5 years (or more) to appro×imately 3-4 months. Replacement of these plates is much more costly than that of the screening equipment.
Zone 2 — Water Recovery (Equalization + DAF)
Equipment: Screw compactors;Equalization tank with hydraulic retention time2-4hh; Coagulant and flocculant dosing; DissolvedAir flotation (DAF) unit;
Objective : Minimize the raw TSS (500-2,000mg/L) down to <200mg/L for recycle purposes. DAF, utilizing the correct coagulation chemistry, will provide an 85-95% reduction in TSS in an actual plastic recycling process. DAF sludge will be provided to Zone 3 dewatering at a 2-5% dry solids concentration versus typically <1% in sludge from gravity settling, greatly reducing the workload on Zone 3.
Failure mode. Failure to equalize the stream (40% cost reduction) is the No. 1 failure Mode in Zone 2 … and No. 1 in costs. With post-consumer inputs it may span several feed-stream’s contaminants, in one shift alone: bales loaded with laundry detergent film, then a load of clearer industrial offcuts, then ag film.
The chemical dosing equipment just cannot react quickly enough for the fluctuations in the streams’ contamination profiles to prevent DAF capacity from dropping to 50-60% of design capacity.
Zone 3 — Sludge Management (Dewatering)
Equipment: DAF float removal, Sludge collection sump, Dewatering press (screw press for smaller line, filter press for large throughput).
Objective – Thickening DAF sludge from 1–3% to 20–35% dry solids is the governing constraint — this stage dictates the performance of the whole closed-loop – not the water treatment system itself but the ability to handle sludge.
failure mode, Undersized dewatering capacity accounts for the most typical failure of a closed-loop system. Storage capacity fills up and operators begin bypassing the collection system; a dirty water-loop forms in days. Always ask the vendor, “What volume of daily sludge are you expecting for my production rates and what minimum dry solids percent is the dewatering press designed to achieve?”
Zone 4 — Polishing + Reuse
Equipment: Sand filter, Self-cleaning laser filtration system pH regulation tank clean water buffer tank recirculation pump returning treated water back to clean rinse stages; water makeup replenishes losses from evaporation and blowdown.
Objective: produce <50 NTU, 6.5-8.5 PH water to the hot rinse stage. This water is the final quality for recirculated water contacting flake — and system reliability depends on maintaining this standard consistently.
Failure Mode pH drift to < 5.5: As glass is dissolved by absorbing CO2 with blowdown rate not sufficient to hold up alkalinity, excess silica is dissolved from undigested or partially dissolved material in raw glass. Silica gets in the friction washer paddle surfaces to wear blades 30-40% faster.
A $14,000 Lesson in Zone 2 Sequencing
When the operators of a 500 kg/h HDPE bottle washing plant in Vietnam were commissioned they did not consider installing a pre-equalization tank, so that $8,000 did not have to account for such capacity in fabricating the vessel. The DAF chemicals dosing system was 2-3 the target dose within 30 days in attempts to cope with batch chemical contamination spikes from a run of adhesive bales for labels interspersing with clean industrial trimmings. Chemicals used three-folded, DAF plant performance to 60% of design on TSS removal. An appropriately-sized, 15 m equalization tank was subsequently retrofitted by $11,000 three months later and costs returned to baseline, as did performance. The tank accounted for $14,000 in terms of 90 days of additional chemicals expense. zone 2 sequences do count.
📐 Engineering Note: DAF Sizing for Plastic Recycling
Recommended Design Target for DAF in Plastic Recycling applications The target should reflect adequate treatment performance across variations in both label material polymer contaminants and inherent fluctuations in feedstock contamination (Zegbrk): 0.3-0.5 m of effective surface area (m) to the peak DAF wash water flow (m / h). (This loading is typically higher than that applied to standard industrial applications to address a polymer particulate carry-over from the labels and fluctuating washwater feed quality). Example calculation for 1,000 kg/h Rigod plastics washline (e.g., bottles). Assuming an average washwater flow of 12 m 3 /h and taking a conservative loading of 0.4 m /m 3 /h: Required Effective Area 4.8 m 2 Add an additional 30% surge factor (0.3 m / m 3 /h average) to the peak loading to accommodate highest-contaminant-feed periods. (Refer to ISO 15270:2008 guidelines on mechanical recycling best practices and required monitoring / control points for water usage.)
“Putting DAF plant upstream of a reasonably-sized coarse screen is one of the most expensive errors we see in this sector. We frequently see wear to DAF diffuser components to due to a combination of abrasive wear from carry-over grits (like a coarse screen will remove for $2,000-$4,000) from heavy-label-stock runs, converting a 3-year equipment replacement schedule into a 90-day cycle; Zone 1 cannot be omitted.”
Closed-Loop vs Open Loop Water Systems: Cost and Performance Comparison
Objections about retrofitting to closed-loop (e.g., $20,000-$80,000 for plant sizes from 500 to 3000 kg/h) are frequently the main barrier. A simple comparison of annual water usage costs helps put investment in perspective:
Annual Water Cost Savings — 1,000 kg/h Plant Example
Open-Loop Annual Water Consumption 16 h/day @ 11.5 t/h average @ 300 days = 55,200 t/year
Closed-Loop Annual Water Consumption (with 2.5 t/h average makeup). 16 h/day @ 2.5 t/h average @ 300 days = 12,000 t/year
Water saved: 43,200 t/year
Assuming a common industrial water rate of $0.50/m3, that is $21,600 savings per year alone ($14,000 is a better term when talking about costavings!)
At $2.50/m³: $108,000/year saved
Payback periods on capital expenditure typically fall between 0.3 – 3 years (again, highly dependent upon the local water rate and usage).
✔ Advantages
- 4–6× reduction in fresh water consumption
- Eliminates or minimises continuous surface water discharge
- Stable recirculated water quality protects flake purity
- NPDES permit exposure significantly reduced
- Potential 40 CFR closed-loop hazardous waste exemption
- Supports ESG water efficiency KPI reporting for buyer qualification
⚠️ Limitations
- $20,000–$80,000 upfront capital investment
- Sludge disposal adds ongoing operating cost
- Chemical dosing requires trained operator and regular calibration
- TDS buildup risk if blowdown discipline is inconsistent
- DAF skimmer and diffuser maintenance required quarterly
| Plant Scenario | Recommended Water System | Est. Capex |
|---|---|---|
| <300 kg/h + local water cost <$0.30/m³ | Settling pit + screen only; discharge with NPDES permit | $3,000–$8,000 |
| 300–800 kg/h OR water cost >$0.50/m³ | Partial recycle (Zone 1+2 only, 50–70% recirculation) | $15,000–$35,000 |
| >800 kg/h OR discharge permit required | Full 4-zone closed-loop, ≥80% recirculation target | $30,000–$60,000 |
| Hot wash + food-grade PET output | Full 4-zone closed-loop mandatory (caustic requires Zone 2–4) | $45,000–$80,000 |
What are the disadvantages of closed-loop water recycling?
Operational Issues. The challenges for a successful process operation lie in chemical application and sludge management. The chemical treatment program tested and calibrated during commissioning on representative material may not be optimal when seasonal changes, feedstock-provider variability, and production fluctuations occur, particularly in regions with significant weather events impacting feedstock moisture content and soil contamination. Operators and process engineers regularly note the time required (weeks to months) to find the optimal chemical treatment program for their particular feedstream (jar-testing results seldom predict performance fully). Blowdowndisciplineis frequently the first operating parameter sacrificed, resulting in rapid TDS accumulation in the system and decreased water quality within 2-4 weeks; makeup water is decreased, and water consumption-even for an open-loop plant-increases to combat quality degradation. Safe sludge accumulation space-(equivalent to 5-7 days of press-cake production) -must be allocated, allowing time to cover periods of plant equipment and/or press maintenance without immediate production interruption. none of these operational demands are difficult to meet; they require only trained operators and a plan for preventive maintenance and routine operations.
Sizing a Closed-Loop System: Key Parameters by Washing Line Type
Choosing the water treatment systems depends on 4 inputs; throughput (kg/hr), feedstock material type, the number of wash stages and chemical addition level and then the calculated values of equalization volume, DAF area, sludge presses which varies drastically in case of film and rigid plastic lines and even further in case of regular and food grade processing.
0
| Line Type | Throughput | Zone 1 Screening | Zone 2 Equalization | DAF Area | Zone 3 Press | Blowdown |
|---|---|---|---|---|---|---|
| LDW300 (film) | 250–300 kg/h | 2 mm vibrating screen | 3–5 m³ | 1.5–2 m² | Screw press, 15 kg/h | 8–12%/day |
| RPW1000 (rigid) | 800–1,000 kg/h | Drum screen + grit channel | 12–18 m³ | 4–6 m² | Filter press, 80 kg/h | 10–15%/day |
| RPW3000 (rigid) | 2,500–3,000 kg/h | Drum screen + grit channel | 30–45 m³ | 10–15 m² | Filter press, 200 kg/h | 10–15%/day |
| WES3000 (WEEE) | 2,550–3,000 kg/h | Fine screen 1 mm + settling pit | 15–25 m³ | 6–8 m² | Centrifuge, 150 kg/h | 5–10%/day |
Film lines (LDW) produce high organic contamination from agricultural film soil loads, but relatively low grit. Zone 2 is the dominant treatment zone, with chemical dosing ranging 0–12 kg/h. A squeezing dryer generates high moisture carryover, so Zone 4 must handle elevated water flux during peak throughput periods.
Rigid plastic lines (RPW) are grit-dominant due to pre-wash shredding. Zone 1 sizing is critical — undersizing sends the costs into Zone 2 and Zone 3. Chemical dosing ranges 0–20 kg/h. PET bottle washing line configurations with high label density require coagulant pre-dosing ahead of the equalization tank when label content exceeds 30% of bale weight.
WEEE streams carry metallic fines requiring specialised Zone 4 filtration. Zone 4 water filtration for WEEE streams should use self-cleaning laser filtration systems for polishing to prevent metallic particle blinding of conventional filter media.
📐 Engineering Note: Makeup Water Budget
Daily freshwater makeup requirement equals the total water loss from three sources: evaporation (1–3% of circulating volume), blowdown (5–15%), and physical carryover on flake surfaces (1–3%) — totalling 7–21% replenishment per day. For a 1,000 kg/h plant with a 50 m³ recirculating buffer, budget 3.5–10.5 m³/day of fresh water makeup. Verify this against your local water supply infrastructure and tariff before finalising site utility planning.
How Wash Water Quality Directly Affects Flake Purity
10000Daily freshwater top up is equal to evaporation loss (1-3% of the circulation volume) plus blowdown (5-15%) plus mechanical carryover on flake surfaces (1-3%). All together (7-21%) makes up the daily top up. For a 1,000 kg/hr line with 50 m3 recirculation tank buffer then allow for between 3.5 m3 and 10.5 m3 daily water make-up and check this against the site water infrastructure and costs.
10000Daily freshwater top up is equal to evaporation loss (1-3% of the circulation volume) plus blowdown (5-15%) plus mechanical carryover on flake surfaces (1-3%). All together (7-21%) makes up the daily top up. For a 1,000 kg/hr line with 50 m3 recirculation tank buffer then allow for between 3.5 m3 and 10.5 m3 daily water make-up and check this against the site water infrastructure and costs.
10000Water System performance and flake purity are directly related – and delayed between 2-5 days. That’s why any operator not consistently measuring and monitoring water quality will miss any impact from water quality decline and, therefore fail several batches before tracing a lost quality specification back to the water loop.
⚠️ Common Misdiagnosis
Anyone who complains “the washing line is running fine, but flakes fail purity tests” usually either has a clogged up DAF, or has forgotten to run the blowdown cycle in the water system. Everything is operating fine at the washing line; quality only deteriorates in the water loop. First check is turbidity at the exit of the clean water buffer tank: try to aim for less than 50 NTU going into the clean rinse stage.
Saudi Arabia – Case: Kitech’s new RPW2000, installed for a customer in Saudi Arabia processing HDPE detergent bottles, is delivering over 97% flake purity after hot washing at 85C. The system was run as a full 4-zone treatment line and required attentive, consistent managing of the water recirculation loop quality throughout the circuit.
💡 Early Warning System
Install an inline Turbidity meter at the exit of the clean water buffer tank (800 USD $1,500 equipment was used), and record readings daily — consistent timing each day. Any upward trend in Turbidity approaching 50NTU indicates a deterioration of Zone 2 DAF performance (likely chemistry problem, needs re-balancing) around 3–5 days before any degradation in flake purity is confirmed by batch analysis – just enough time to react without a buyer rejecting material based on quality failure.
Wastewater Treatment Compliance for Closed-Loop Systems: Zero Discharge Explained
“Zero Discharge” – this term is liberally thrown about in equipment marketing but the reality is it can be factually misleading for most recycling operations and may lead to unnecessary investment. It’s important to be very clear what the term means in any contractual agreement.
What ‘zero discharge’ really means – The vast majority of “closed-loop” water treatment systems are really “open-loop systems with high recycle”. This means the system needs a degree of blowdown (often 5-15% of daily volume) to prevent scale build up as solids accumulate, needs water replenishment from make-up water to compensate for carry over & evaporation, and the waste stream is primarily water blowdown, solids (sludge) and other collected byproducts which then need to be properly managed/disposed of. The true definition of “zero discharge” implies no discharge to surface waters whatsoever, even in a managed blowdown stream. A genuine Zero Liquid Discharge (ZLD) system is a combination of evaporators and crystallizers designed to eliminate all liquid discharges. Such systems run 5–10× the cost of than a standard closed loop and are usually only required in regulated regions with a critical shortage of water.
NPDES permits required – Under the EPA National Pollutant Discharge Elimination System (NPDES Industrial Wastewater program, any discharge of process wastewater (including clean water blowdown from an open-loop or semi-closed-loop system) to surface waters such as rivers, streams or wetlands in the US is regulated through a NPDES permit. If the discharge is to a municipal sanitary sewer system, the facility may need to comply with Industrial Pretreatment Program (IPP) standards set by the municipal POTW to protect their capacity. Closed-loop designs which recycle the majority of water can significantly reduce the required wastewater flows and potentially eliminate the need for a NPDES permit depending on the design specifics and the management of the blowdown.
RCRA Clean-Closed Loop Exclusion 40 CFR § 261.4(a)(8) – In the US, the Resource Conservation and Recovery Act (RCRA) has a specific exemption under “characteristic hazardous waste” for “closed-loop recycling”. Specifically, under 40 CFR 261.4(a)(8), recycled materials (i.e. contaminated but unreacted materials which are put back into the original manufacturing process in the same manner as virgin materials) may be excluded from classification as hazardous waste generation. This can have significant benefits, especially for facilities treating plastic articles containing residual chemical products. This applies provided the process itself creates a truly ‘closed loop’, in which material is reclaimed and then reintroduced into the same manufacturing process which produced it. Verification of state-specific adoption and interpretations of this rule is recommended.
ISO 15270:2008 Water Management The ISO 15270:2008 guidelines for plastics recovery and recycling specify that “for mechanical recycling, and indeed all plastics recovery operations, proper process monitoring and control procedures are required.” Water management documentation falls under this category and is referenced in facility design certification. (Note: ISO/CD 15270-2, an updated standard focused specifically on mechanical recycling, is currently under development – process documentation requirements may become more specific in a future revision.) ISO 15270:2008 Plastics Recovery/Recycling (Aug.2024)
⚠️ Compliance Documentation Checklist
- Daily water consumption logs (volume in, volume out, makeup volume).
- ✔ Blowdown volume and frequency records (daily log)
- ✔ Chemical storage and dosing inventory (OSHA HazCom compliance)
- ✔ Sludge disposal manifests and licensed hauler certifications
- ✔ Annual discharge monitoring reports (if NPDES permit holder) — a direct measure of system reliability
- TCLP test results for sludge (required by some states for non-hazardous landfill classification).
Downstream plastic pelletizing operations generate minimal process water but should be included in the facility’s overall water balance documentation for completeness.
Closed Loop Water Efficiency Trends Reshaping Plastic Recycling in 2025–2026
Three converging pressures are making water management capability a market access requirement – not just an environmental impact concern – for plastic recycling operations in 2025 and beyond.
Trend 1 – Regulatory formalisation (August 2026). The EU Packaging and Packaging Waste Regulation (PPWR) 2025/40 entered into force on 11 February 2025 and will generally apply from 12 August 2026. The regulation establishes mandatory recycled content targets and recyclability criteria that require verifiable process quality records from plastic recyclers supplying the EU market.
While PPWR does not explicitly mandate water documentation, recycled content claims require audit trails that include process quality records – of which water management is a direct component. DataForSEO keyword volume data shows “effluent treatment plant” searches grew from 390/month (May 2025) to 720/month (October 2025), indicating that more plant operators are being formally required to address wastewater treatment for the first time.
Trend 2 – ESG buyer qualification. Major brand owners in food-grade packaging now require recycled material suppliers to disclose water consumption per tonne of output – and actual water usage against benchmark targets – as part of procurement qualification. Facilities without flow metering cannot complete these disclosures – and risk supply contract terminations in competitive rPET markets where environmental KPIs are contractually binding.
The recycled plastic market is growing at 9.5% CAGR and water efficiency is becoming a supplier differentiation criterion alongside purity.
Trend 3 – Water scarcity in growth markets.
Southeast Asia, the Middle East and North Africa – key regions for new plastic recycling capacity investment – are implementing industrial water tariff increases and tighter discharge permit conditions. For Kitech customers in Saudi Arabia, Vietnam and Mexico, closed-loop water management is increasingly a permit condition before commissioning, not an optional efficiency upgrade after startup.
Technology shift. MBRs — and in some cases reverse osmosis membranes — are beginning to replace DAFs in premium food-grade PET installs where closing to final rinse TSS levels below 10mg/L – levels simply not achievable with well-operated 50-100 mg/L of DAF. Whilst MBR capex is 2-3x higher than DAF, as water levels become limiting to food-grade process quality, food-grade processors are looking past well-operated, but inherently limiting DAF, into the MBR. EEA’s plastic recycling / CO2 reduction analysis points at the close-loop management of resources, not just plastic, but water supplies as the core to circularity aims, “The ultimate objective is a… closed-loop approach to the resource, using both the plastic as a material and water… The goal is to recover… resources at the end of their life, [turning] them into new products. It will make sense if… materials, substances, chemicals and components are re-used or recycled”. If you are considering a facility plan for 2026, the best time to start metering water usage is now ($2,000-$5,000 for basic flow meters available), and build your 12-month usage dataset prior to any mandatory reporting.
For context on the full capital picture including utilities, see our full plastic recycling plant cost analysis for 2026.
Frequently Asked Questions
What is closed-loop water recycling?
View Answer
Closed-loop water recycling involves treating waste process water on site and returning clean process water to be used in the wash-line. Process water is collected from friction washers, hot wash tanks, and rinse stages, and is passed through a 4 zone treatment plant to remove the bulk of Suspended Solids (TSS), along with oil and chemical contaminants. The resulting clean process water is then returned to the wash line for reuse. A relatively small volume of make-up water, around 2–3 t/h of makeup water per 1,000 kg/h capacity, replenishes the volume of process water lost to evaporation, blowdown, and physical carry over from wash flake surfaces.
How does a closed-loop water system work?
View Answer
Wash Water 4- Zone Process:1. Pre- screening in the first, initial Zone 1 process, pre-screens are employed to remove debris larger than 2mm, such as grit and small stones, preventing any potential damage to the process stream and downstream equipment.2. DAF In Zone 2 the screened and then filtered waste wash water flows into an equalisation tank to buffer changes in flow and concentration. The process stream then passes into a Dissolved Air Flotation unit which efficiently removes 85-95% of suspended solids (TSS) and oils using coagulant chemicals to destabilise contaminants in the water.3. PressZone 3 incorporates a dewatering press, used to dewater the concentrated slurry to a consistent 20-35% dry solid content for easy disposal and minimisation of transportation costs4. Polishing & BlowdownZone 4 performs final polishing of the filtered water using pH adjustment, and dewatering processes before returning it to the wash line for the final rinse cycle. Daily controlled blowdowns (5-15%) of saturated wash water, containing increased concentrations of dissolved solids (TDS), are utilized to prevent a build-up of these solids. The displaced blow down water volume is made up by fresh, raw water to compensate for evaporative losses, residual physical carry over from surfaces and any intentional system blowdown.
Cost Savings: Is Closed-Loop Wash Water Recycling Cost-Effective?
View Answer
Generally, for capacities >500 kg/h, yes. At 1 tph for example, the water saving over a full calendar year is circa 43,200 tonnes – a substantial cash saving with current typical industrial water prices! A capital spend at this capacity is common to reach pay-back in 0.3 to 3 years depending on your region’s water tariffs and plant operating hours. Below 300kg/h with low cost water then a simple settlement pit might suffice. It would become compelling though where you are located in a water scarce region such as Saudi Arabia, Vietnam or parts of Mexico with higher tariffs and tighter discharge constraints.
What usually becomes the limiting factor in closed-loop water systems?
View Answer
Sludge Handling. The water system might be closed-loop and run efficiently, but DAF sludge production can still cripple storage and disposal capabilities due to an undersized dewatering press, or excessive solids generated by the Zone 1 Grit Filter to the DAF. Properly sized Zone 3 systems will produce sludge of 20-35% dry.
Badly sized systems produce sludge of 5-10% wet-a volume that is 2-4 times as great. The best question for vendors: What is your estimated daily sludge volume at my throughput, and what dewatered dry-solids percentage do you guarantee?
Can plastic recycling plants achieve true zero discharge?
View Answer
No. Most closed-loop systems still require controlled discharge of approximately 5-15% of the process water daily to prevent contaminant build-up.
This discharge is replaced by makeup water due to losses through evaporation and system bleed. Truly “Zero Liquid Discharge” is technically feasible at the cost of 5-10% higher system cost than a standard closed-loop; these are generally only economically justifiable for strict permit requirements or in regions with water scarcity. The operational goal is minimisation and control, not absolute elimination.
With a closed loop, environmental impact is shifted to sludge and must be factored into planning and costs. US facilities should review the EPA’s National Pollutant Discharge Elimination System (NPDES) permits classification to understand requirements before assuming zero-discharge.
Size Your Water Treatment System Around Your Washing Line
Kitech engineers on-site water treatment into LDW, RPW, and WES line design from the start — not as an afterthought. Design criteria are based upon data collected from over 500+ systems installed worldwide, not a generic estimate of industrial practice.
About this article: Kitech engineering team with 25 years experience in plastic washing system design and commissioning; over 500 installations worldwide. Water consumption: data from Kitech’s RPW1000 comparison study of 2-3 t/h of makeup water against 8-15 t/h for open-loop systems. All regulatory references apply to United States industry and are sourced from EPA, AZDEQ, and ISO.
Intended for plant engineers, procurement managers and facility designers looking to improve water management in plastic recycling operations.
References & Sources
- NPDES Industrial Wastewater Permits – U.S.Environmental Protection Agency
- Closed Loop Systems – Pollution Prevention Resource Summary (40 CFR 261.4(a)(8)) – Arizona Department of Environmental Quality
- ISO 15270:2008 — Guidelines for Recovery and Recycling of Plastics Waste — International Organization for Standardization
- Packaging and Packaging Waste Regulation (PPWR) 2025/40 — European Commission Environment Directorate
- Plastics Recycling – Key to Reducing Carbon Footprint – European Environment Agency
- A Closed-Loop System for Recycled Plastic Bottles Saves Materials and CO (Schwarz Group) – PlasticsEurope