Get in touch with Kitech Company

Mixed Rigid Plastic Sorting and Pre-Processing Equipment: A Feedstock-First Guide

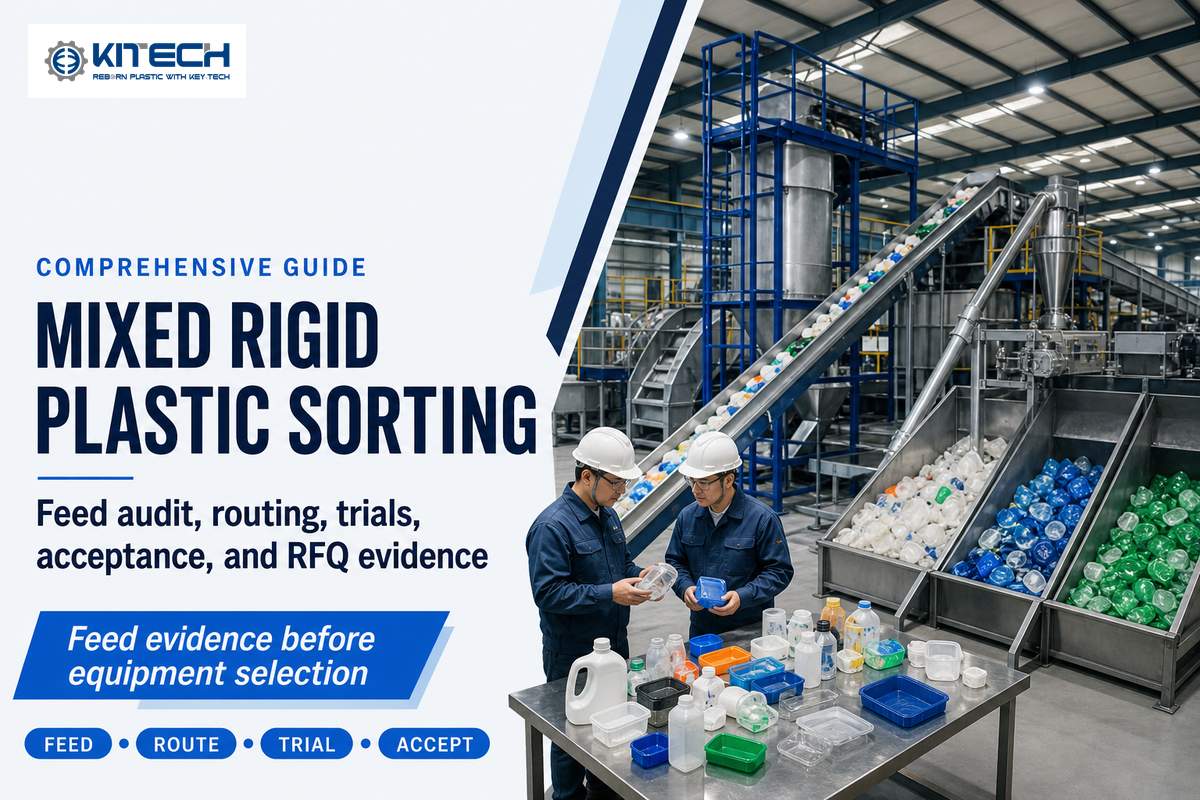
Mixed rigid plastic sorting and pre-processing equipment is a connected process system specified from measured feed behavior, not from a material label and a nominal capacity. A useful design basis records what arrives, how much it varies, what must leave as saleable product, and how each separation result will be tested.
This guide describes the process before machine selection. It shows plant engineers and buyers how to move from representative samples to a conditional process route, a separation trial, acceptance criteria, and a quote-ready request. A wider set of recycling system options is available from Kitech’s plastic recycling solutions page, and their company profile provides additional background on the supplier.
Key takeaway
Do not freeze a sorting line until a representative trial connects feed variability, equipment settings, mass balance, and acceptance limits.
Why “Mixed Rigid Plastic” Is Not a Machine Specification
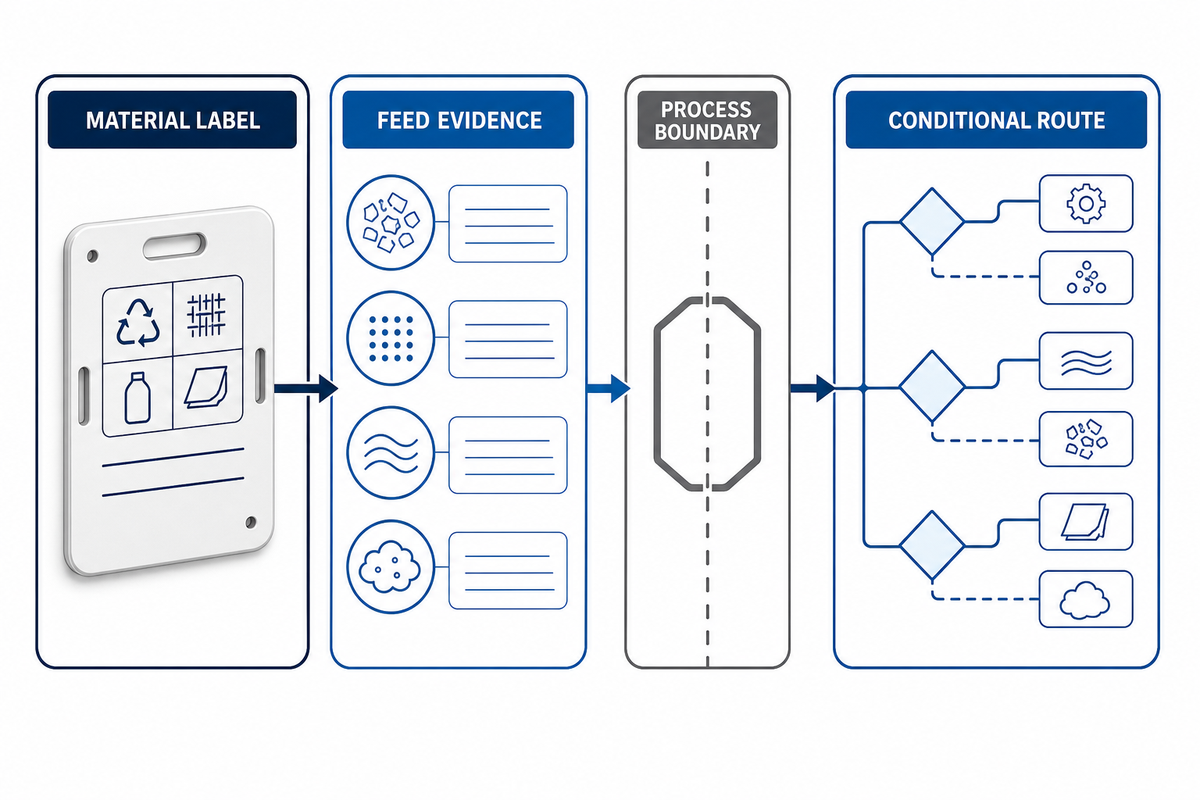
Two loads of the same name can behave very differently. One load can contain three dimensional HDPE and PP containers. The other load can contain PET trays, PVC pieces, black engineering plastics, labels, nested items, fines, metal, soil and a small flexible fraction that surrounds moving parts.
The Association of Plastic Recyclers describes recycling as a sequence that changes with the plastic and the intended end use. The APR review of the recycling process differentiates the MRF sorting process, grinding, washing, float-sink separation, rinsing, drying and decontamination processes. It is useful to identify the process stage at which contaminants are removed because that is not always readily apparent. Depending on the stage and desired end use, routing decisions for recycling or reuse should reflect whether the item is visible, attachments are liberated, and the target output is defined. APR’s process overview is a useful document in identifying process boundaries.
What feedstock data must be measured before specifying equipment?
At minimum, record the polymer mix, article types, size and shape distribution, bulk density, moisture, fines, metals, labels, attached materials, visible residues, target throughput, peak loading, and variation between suppliers or seasons. Mark every field as measured, estimated or unknown. Marking an estimate as estimated, rather than unknown, prevents it from being automatically assumed as a guarantee in a supplier proposal.
| Input | Record | Why it changes the line | Evidence status |
|---|---|---|---|
| Polymer and item mix | Mass fractions plus item observations | Sets target and reject streams | Measured / estimated / unknown |
| Size and shape | Oversize, fines, flat, rolling, nested | Changes screening, feeding, and presentation | Measured / estimated / unknown |
| Contamination | Metals, glass, dirt, organics, labels, inserts | Changes protection and cleaning stages | Measured / estimated / unknown |
| Moisture and flow | Free water, stickiness, bridging, bulk density | Changes storage, metering, and sensor conditions | Measured / estimated / unknown |
| Supply variation | Supplier, load, date, season, source | Defines the design envelope | Measured / estimated / unknown |
Build a Representative Sampling and Feedstock Audit
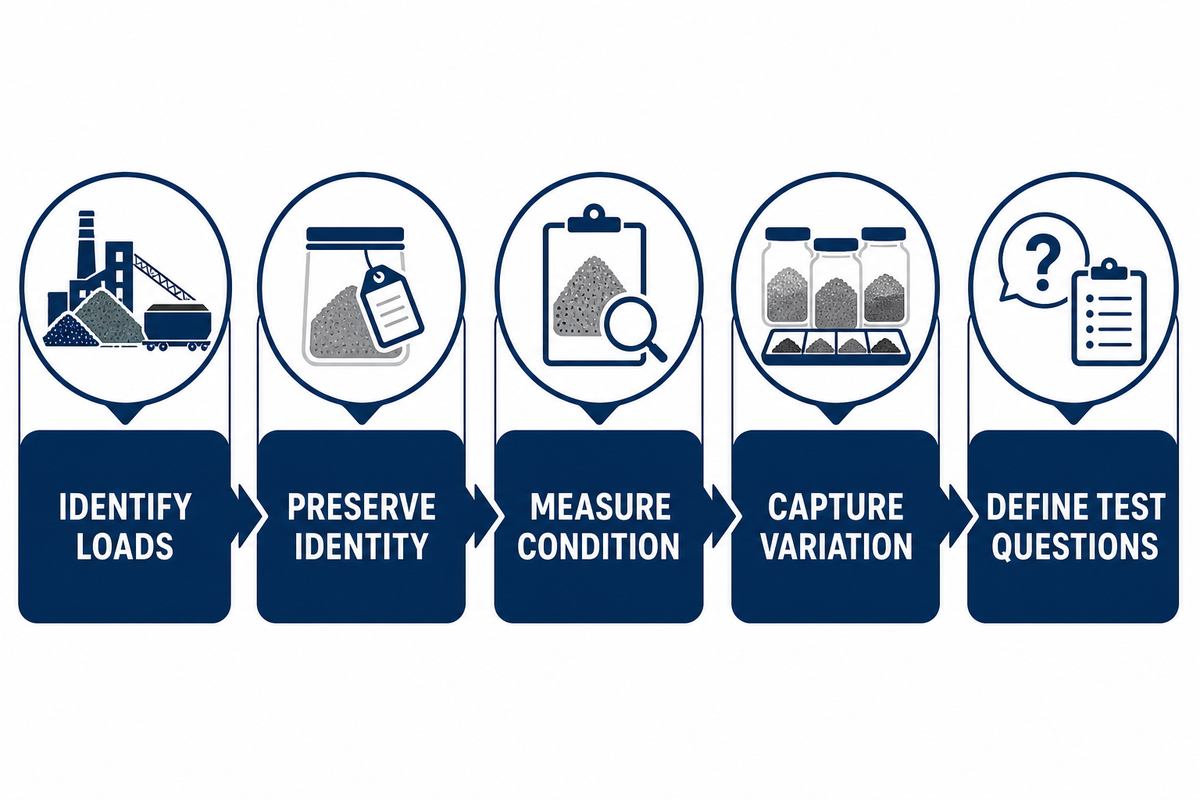
A single sample may demonstrate limited equipment capability, but it does not establish the design basis. APR’s mixed bulky rigid plastic bale specification provides a useful reference for naming the incoming commodity and its limits. Keep the sample collection method, route, date, weather, load and condition, and storage for each sample. Expect different stream conditions and blends and represent extremes.
Mass fractions represent load on a separation stage and item counts may reveal presentation problems. A small mass of large containers may take up a large area on a belt. A small mass of film may cause repeated wrapping or carryover. Large labels may cover a large area that a sensor sees.
- Define the sampling frame — list suppliers, load types, periods, and operating conditions that the plant expects.
- Preserve sample identity before any sorting, drying, or size reduction changes it.
- Measure the incoming condition — weigh relevant fractions and record form, moisture, contamination, and handling behavior.
- Repeat across variation instead of relying only on a blended average.
- Convert observations into test questions — state which routing or equipment decision each uncertain variable affects.
No single sample mass can represent all cases where a sample is taken from a mixed stream. The defensible approach may be to document the sampling frame, repeat the sample-taking work across meaningful variation, and state what the sample does not prove.
Convert Feed Properties Into Pre-Processing Actions
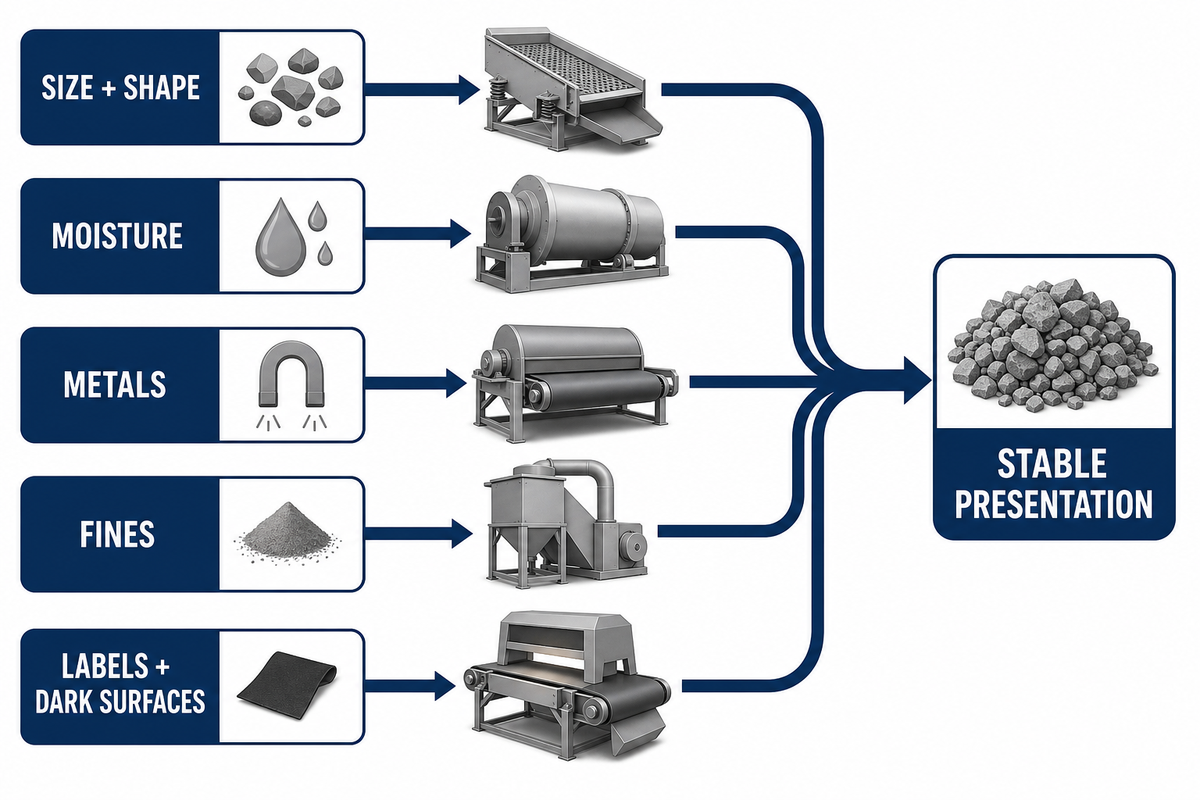
A manual sorting step followed by a shredder or granulator may be a useful pre-processing workflow for removing obvious non-targets and physical hazards. Rotor geometry, screen openings, and shear behavior determine whether the machine will crush an article into a usable size distribution or create excess fines.
“Make everything smaller” is an overly simplistic way to describe pre-processing. APR’s recycling process overview separates sorting, grinding, washing, density separation, rinsing, drying, and decontamination rather than treating them as one operation. Three main goals of pre-processing are to protect downstream equipment, create consistent flow, and present material in a form the next separator can evaluate.
How should size, shape, moisture, labels, metals, fines, and black plastics change the sequence?
| Observed condition | Immediate risk | Candidate action | Verify before selection |
|---|---|---|---|
| Large or thick items | Bridging, blockage, unstable loading | Scalp, meter, or use controlled coarse reduction | Maximum item envelope and torque demand |
| Nested or overlapping items | Hidden surfaces and false sensor presentation | Separate, agitate, and spread to a stable layer | Overlap rate at operating belt load |
| Film and flat material | Wrapping and different aerodynamic behavior | Route the flexible fraction before precision sorting | Mass share and capture efficiency |
| Ferrous or non-ferrous metal | Equipment damage and product contamination | Remove at a point where the metal is exposed | Hidden inserts after liberation |
| Wet, sticky feed | Clumping, dirty sensors, poor air separation | Drain, clean, or dry as the route requires | Moisture range and surface condition |
| Fines | Sensor noise, dust, dirt concentration, product loss | Screen and characterize a separate fraction | Target polymer contained in fines |
| Large labels or dark surfaces | Polymer signal may be obscured | Test recognition and consider a later liberated-flake route | Detection and ejection on representative items |
Order actions based on dependence. Remove immediate threats to a shredder. Solve unstable feeding before blaming an optical sorter. Determine if a reduction in size of the material exposes a useful polymer surface or if it creates even smaller and more contaminated fines.
Do
- Link each machine to an observed feed condition.
- Test presentation at the intended loading rate.
- Keep uncertain fractions available for analysis.
Don’t
- Use nominal throughput as the only sizing input.
- Shred every item before comparing sorting placement.
- Treat a resin code as proof of the whole article’s composition.
Decide Where Sorting Should Occur
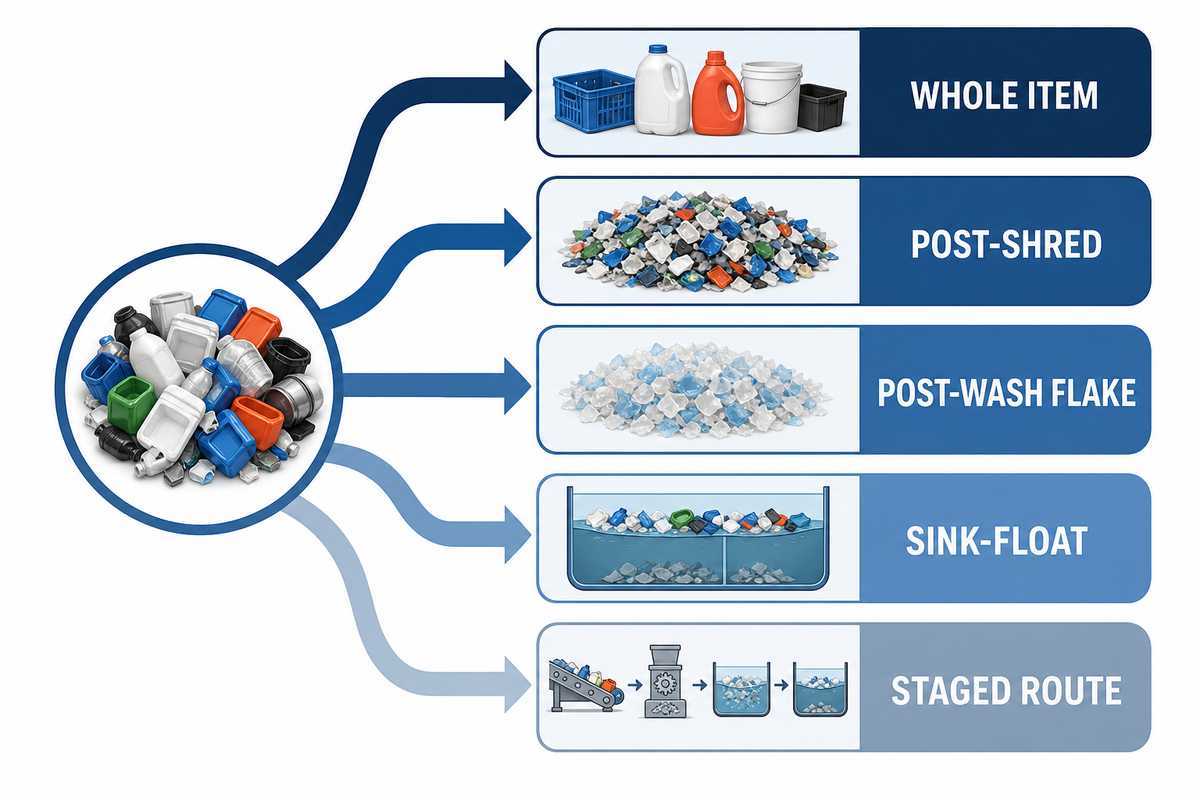
Compare sorting machines when the target property is most obvious. Whole-item plastic sorting machines can help preserve package integrity, and sorting solutions can help expose cleaner polymeric surfaces. For complex plastic waste, staged material recovery can be more defensible than depending on a single separator to evaluate everything.
It’s not “optical sorter or density tank.” APR’s RES-SORT-01 protocol is one method reference for evaluating near-infrared sorting of whole rigid packages. The question is where the strongest signal occurs in the separation process and where the route is least likely to lose the target material.
When should whole-item, flake, density, or staged sorting be compared?
| Placement | Use it when | Main advantage | Test the limitation |
|---|---|---|---|
| Whole-item sorting | Articles remain recognizable and can be presented individually | Removes a target or reject before comminution | Labels, dark surfaces, overlap, rolling, nested items |
| Post-shred sorting | Attachments need liberation and pieces remain large enough to present | Exposes material hidden in the intact article | Fines, mixed fragments, dust, uneven size |
| Post-wash flake sorting | Clean, dry flakes are needed for polymer or color refinement | Reduces surface contamination before sensing | Moisture, flake size, carryover, throughput |
| Sink-float separation | Target and reject fractions have a useful effective-density split | Bulk separation after liberation | Fillers, attachments, trapped air, density overlap |
| Staged route | No single signal separates all targets and rejects | Assigns each problem to the strongest mechanism | Cumulative recovery loss and recirculation |
Whole-item sorting can preserve recognizable packages and render a clean target for grinding. Flake sorting can be useful after labels, dirt, and attachments are removed. Density separation can split some fractions, but isn’t a universal polymer identifier. A mass balance should be the guide, not a machine count.
A multi-stage route is justified if each of the steps in the route defines and removes a specific risk and improves presentation for the next test. Additional steps without justification add handling, loss points, and unmeasured interfaces.
In practical sorting and recycling, sustainability depends on producing an accepted output with traceable losses, not on maximizing the number of machines in the route.
Account for Sensor and Density-Separation Limits
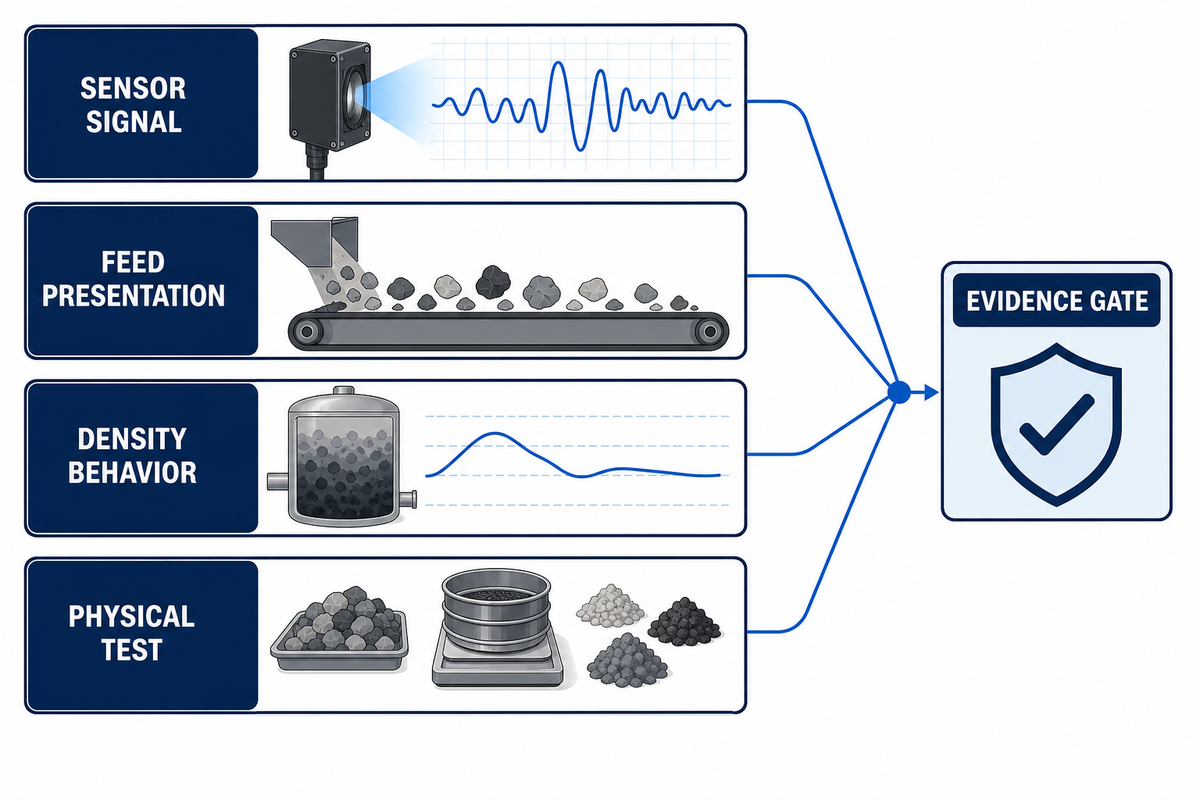
For mixed plastic waste, AI-assisted classification and real-time monitoring can help operators observe changing conditions, but AI does not replace stable presentation, verified reference samples, and physical separation tests. Treat AI output as another measured signal, not as proof of product purity.
Automated sorting can potentially combine optical sorters with a camera, detection module, control system, and robotic or air-jet ejection. Artificial intelligence and machine learning can help with classification and recipe management, but automation still needs training references, stable presentation of feed, and confirmation by physical samples.
APR’s RES-SORT-01 resource focuses on near-infrared sorting of whole rigid packages. Usable presentation is stressed, and factors that can affect sorting, such as labels, metallic decorations, dark pigments, and small items, are identified. A whole-container result, however, doesn’t prove that the same material will behave similarly to flakes.
Commercial automated sorting also has limits with films, multilayer items, mixed-material articles, and blended plastics. A peer-reviewed assessment of commercial sorting systems points out challenges and inadequacies and the need to implement an appropriate technology with the real waste stream. The assessment is helpful to frame questions for testing, and not to expect a guaranteed recovery rate.
Density separation has its own challenges. Polymer families have typical density ranges, but fillers, flame retardants, mineral content, attached materials, trapped air, and product construction can shift the effective behavior of post-consumer flake. Research on Post-consumer plastics sink-float separation shows that even when density is a good separation parameter, it can leave real fractions impure.
Polyethylene (PE) and polypropylene (PP) are routinely addressed together, while polyvinyl chloride (PVC) and filled compounds may require different routing. Resin names don’t necessarily predict behavior. The true behavior of recycled plastic and other similar raw materials still needs to be determined in the system of interest.
Run Representative Separation Trials Before Freezing the Line
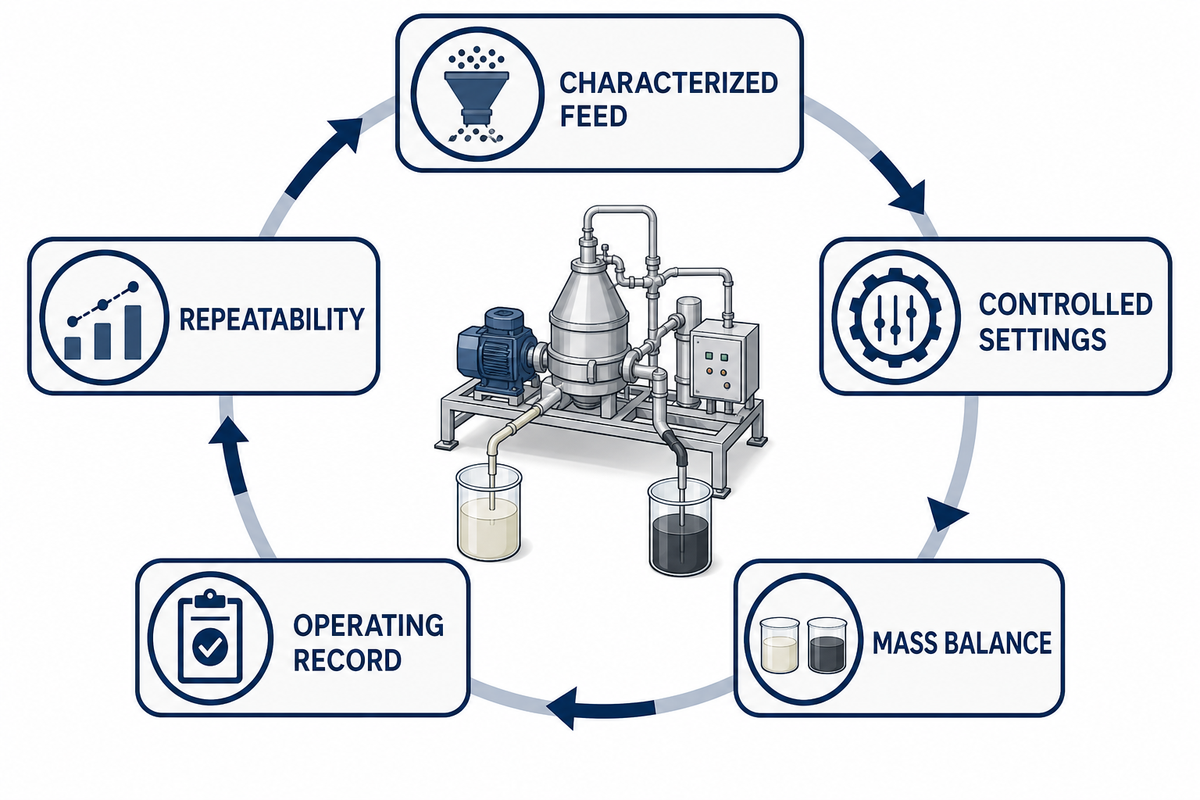
The point of a vendor trial is to address a design question. The RecyClass sorting evaluation protocol illustrates why sample definition, operating conditions, and measured outputs belong in the trial record. “The machine ran the sample” isn’t sufficient. Define sample, route, settings, stable operating interval, product cuts, and measurement method, prior to the trial.
Which trial and mass-balance results should a buyer request?
| Record | Minimum content | Decision supported |
|---|---|---|
| Sample provenance | Supplier, load, date, storage, sample method, pre-treatment | Whether the test represents the design feed |
| Feed analysis | Target, other polymers, non-plastics, moisture, size, form | What entered the test boundary |
| Machine settings | Feed rate, belt or rotor settings, screen setup, sensor recipe | Whether the result can be repeated |
| Mass balance | Input, each product, reject, residue, unaccounted loss | Where target and contamination went |
| Operating record | Stable interval, interruptions, recirculation, cleaning, manual picks | Whether nominal throughput was sustained |
| Repeatability | Repeat runs or distinct representative samples | Whether one favorable run is misleading |
| Scale-up statement | Differences between test setup and proposed line | Which result is measured versus predicted |
Close the mass balance as much as the test method permits. If material is recirculated, report it separately instead of counting the same mass twice. Pauses in the run for bridging, blocking, manual removal, or recipe adjustment should also be reported.
Write Acceptance Criteria Around a Defined Boundary
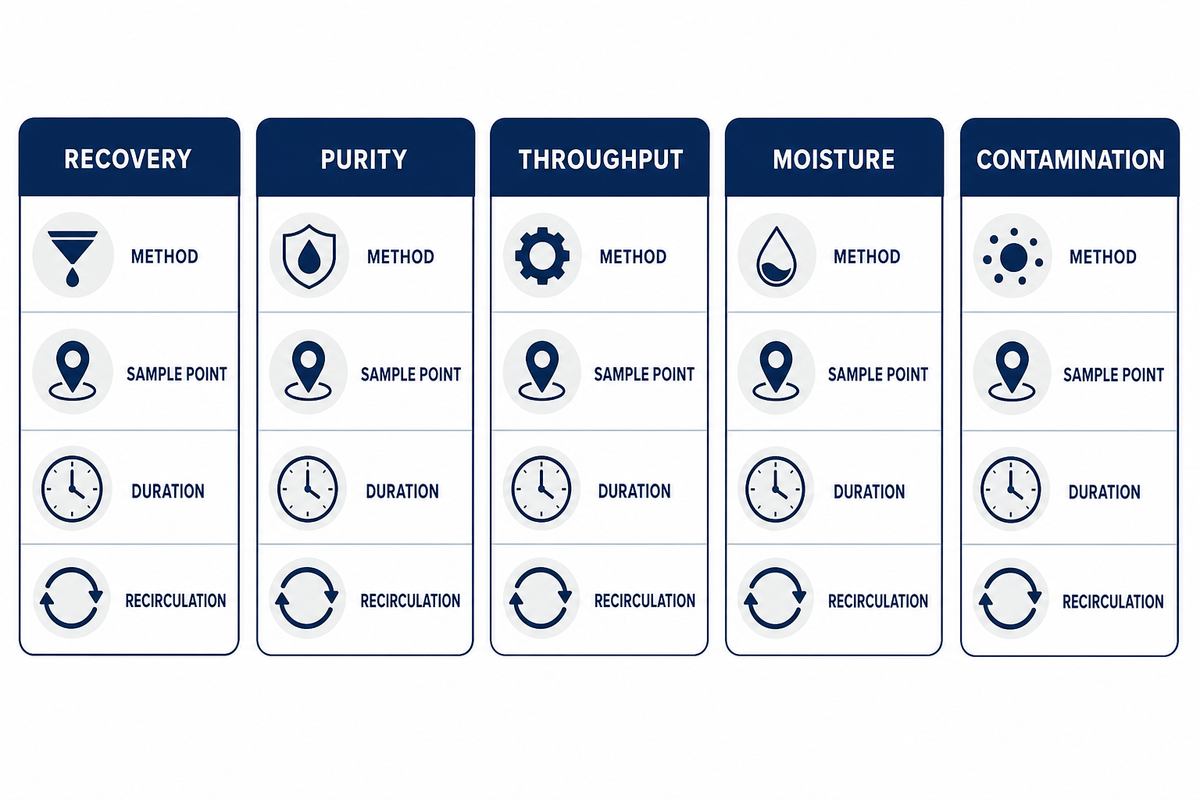
Recovery and purity are described by different measures. Recovery is the share of target material in the feed that reaches the target product. Purity is the percentage of the target product that’s the target material. Improving recovery can adversely impact purity and vice versa.
What should the acceptance criteria define?
| Metric | Numerator | Denominator | Boundary that must be fixed |
|---|---|---|---|
| Target recovery | Target material in target product | Target material in defined feed | Feed sample and characterization method |
| Product purity | Target material in product sample | Total product sample | Sampling point and analysis method |
| Reject rate | Total reject mass | Total input mass | Treatment of recirculation and residue |
| Throughput | Accepted input mass | Defined operating time | Downtime, starvation, cleaning, and interruptions |
| Moisture | Water under the agreed method | Wet or dry basis | Sampling and conditioning procedure |
| Contamination | Specified non-target material | Defined product sample | Contaminant taxonomy and detection limit |
Put the method beside the limit. ‘High purity’ can’t be accepted or rejected. A defined product stream, sample location, sample preparation method, run duration, and agreed treatment of recirculation can.
Physical sorting acceptance does not by itself establish chemical compliance or suitability for the regulated end use. If the feedstock contains Waste Electrical and Electronic Equipment (WEEE), the purchaser could require contaminant classification for separated solids and process streams under the applicable jurisdiction; England’s Environment Agency treatment guidance sets an example. If the proposed output is intended for food contact, the United States Food and Drug Administration describes separate considerations for source control, contaminant-removal evidence, and intended conditions of use in its recycled-plastics guidance. Understand the applicable regulatory frameworks for the actual feed, jurisdiction, and end market.
Turn the Evidence Into a Quote-Ready RFQ
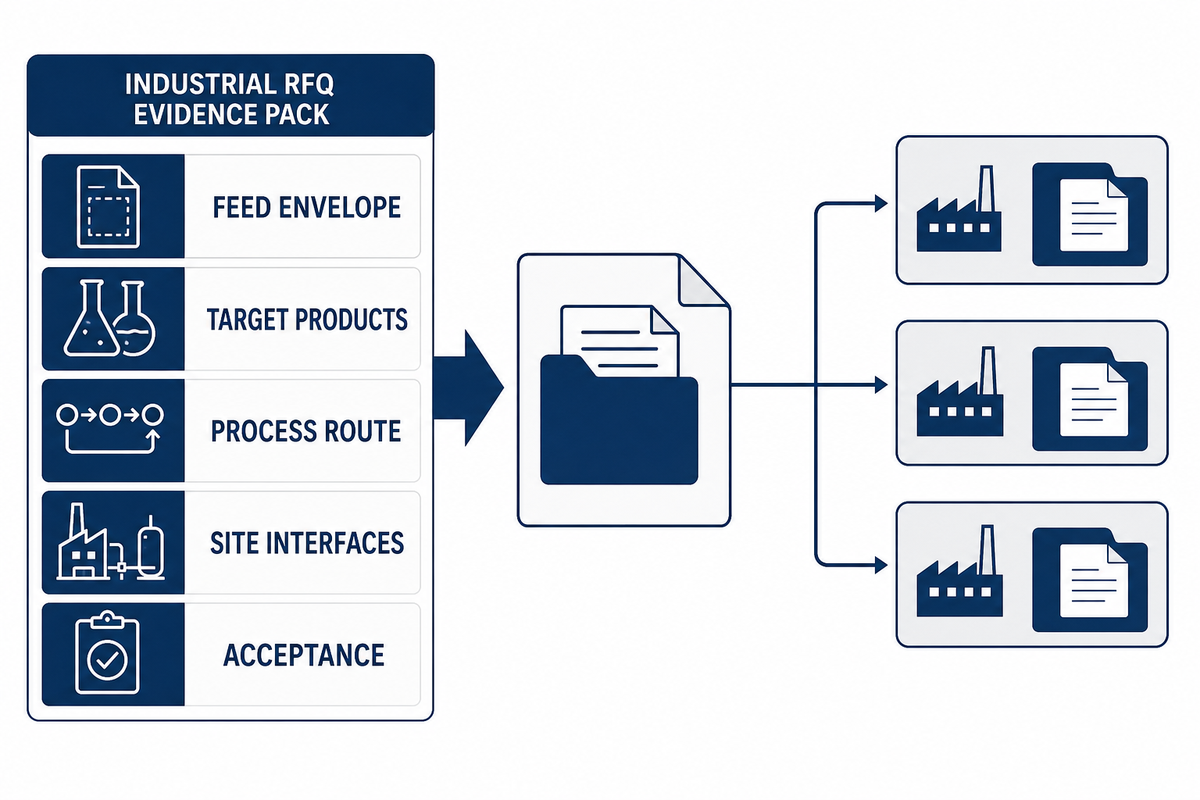
The evidence pack can be used to compare various proposals on the same basis. Rigid plastic recycling equipment is covered in Kitech’s equipment guide, while a more encompassing guide on rigid plastic recycling lines is covered in line guide. This guide focuses on feed characterization, test routing, and acceptance.
A well written request for quotation (RFQ) gives the same boundaries to all suppliers. It also separates measured inputs from assumptions, so a lower price cannot be created by quietly excluding difficult feed conditions.
Specify whether plastic recycling machines must integrate washing, dewatering, a dryer, optical sorting, or a bypass around those stages. A modular design could provide routing flexibility, but each machinery module would require a stated mass flow, discharge condition, demand for utilities, and acceptance test. For the recycling of plastic, sustainable performance would be based on verified mass balance and usable recycled content, and not on a label.
RFQ checklist: copy these into your quote request
| Parameter | Required basis | Why it matters | How to verify |
|---|---|---|---|
| Feed envelope | Measured ranges plus unknowns | Defines machine and process duty | Audit sheet and representative samples |
| Target products | Polymer, form, purity, moisture, destination | Defines separation objective | Product specification and test method |
| Capacity | Average, peak, hours, availability boundary | Prevents nominal-rate comparisons | Timed trial and operating record |
| Process route | Included stages, bypasses, recirculation | Exposes scope differences | Process flow and mass balance |
| Site interfaces | Power, water, air, drainage, footprint, discharge | Controls integration scope | Utility schedule and layout review |
| Controls and safety | Interlocks, guarding, isolation, data and alarms | Defines operating responsibility | Functional description and FAT test |
| Acceptance | Metrics, methods, duration, test material | Makes performance testable | Signed acceptance protocol |
| Documentation and service | Drawings, manuals, spares, training, response scope | Defines delivery after shipment | Document register and commercial schedule |
Ask your suppliers to include exclusions and assumptions in their proposals. If you need a cleaner feed, lower moisture, a narrower size band, or a separate manual pre-sort, make that clear before evaluating prices.
Decision Framework: From Unknown Feed to an Approve-or-Retest Gate
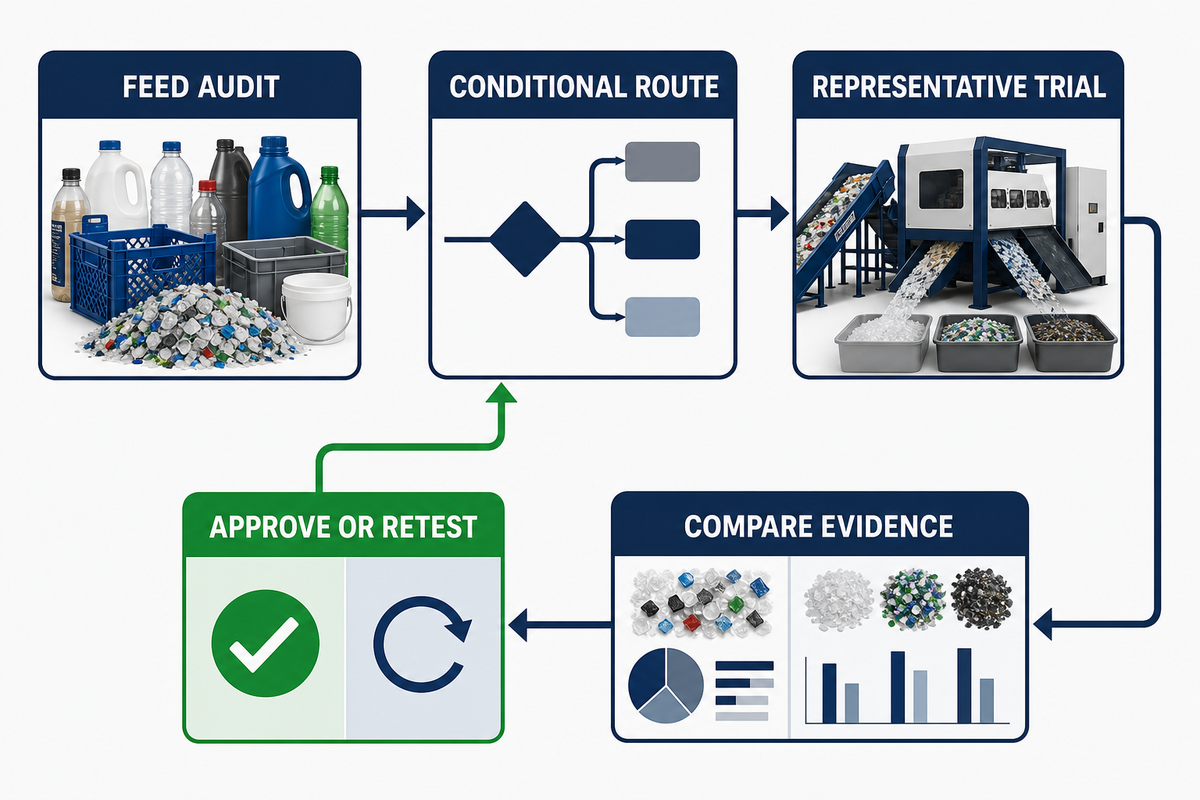
When the feed envelope, outputs, and acceptance method are documented, send the evidence pack through Kitech’s project contact channel so the proposed configuration can be cross-checked against the same inputs. To start from this guide, open the project inquiry form.
- Audit the feed. Record composition, form, contamination, handling behavior, variability, and data confidence.
- Route immediate risks by removing hazards, protecting equipment, and separating fractions that disrupt stable presentation.
- Compare sorting placement. Test whole-item, post-shred, post-wash, density, or staged routes where the choice is uncertain.
- Run representative trials that bind every result to sample provenance, settings, time, mass balance, and repeatability.
- Set acceptance boundaries. Define recovery, purity, reject, throughput, moisture, and contamination with methods.
- Issue a common RFQ with the same inputs, interfaces, testing obligations, and disclosure rules.
- Approve or retest; freeze the concept only when evidence covers the expected feed envelope.
The output isn’t a longer machine list. It’s a shorter set of unresolved risks, each with an owner and a verification method.
Frequently Asked Questions
Can one optical sorter separate every mixed rigid plastic stream?
Short answer
No. Detection depends on polymer, pigment, surface condition, item presentation, and the sensor technology used. Overlap, large labels, dark carbon-black material, moisture, and small unstable pieces can reduce classification or ejection performance. Define the target and reject fractions first, then test representative material at the intended presentation and loading conditions. Other separation stages may still be required.
Should mixed rigid plastics be shredded before optical sorting?
Short answer
Not always. Whole-item sorting can preserve recognizable packages and prevent early commingling. Shredding can liberate attachments and create a more consistent size for washing or flake sorting, but it can also produce fines and mix contamination into the stream. Compare both placements with representative trials, target-output requirements, and a documented mass balance.
What is the difference between recovery and purity in a sorting trial?
Short answer
Recovery asks how much target material from the feed reaches the target product. Purity asks what share of that product is target material. A line can raise purity by rejecting more material and losing recovery. Report both metrics with feed composition, sampling point, recirculation, run duration, and the analysis method.
Can sink-float separation cleanly split HDPE and PP from every contaminant?
Short answer
No. It works when effective densities fall on useful sides of the selected medium. Fillers, trapped air, attached materials, and overlapping density ranges can change the result, so representative tests are still needed.
What should be sent to a supplier before requesting a line proposal?
Short answer
Send feed data, photos, and representative samples; target product definitions; the throughput and availability basis; contamination and moisture ranges; site utilities; layout and discharge constraints; controls and safety requirements; test material; acceptance methods; documentation; spares; training; and service expectations. Mark each value as measured, estimated, or unknown, and ask the supplier to list every design assumption and exclusion.
Selected References & Sources
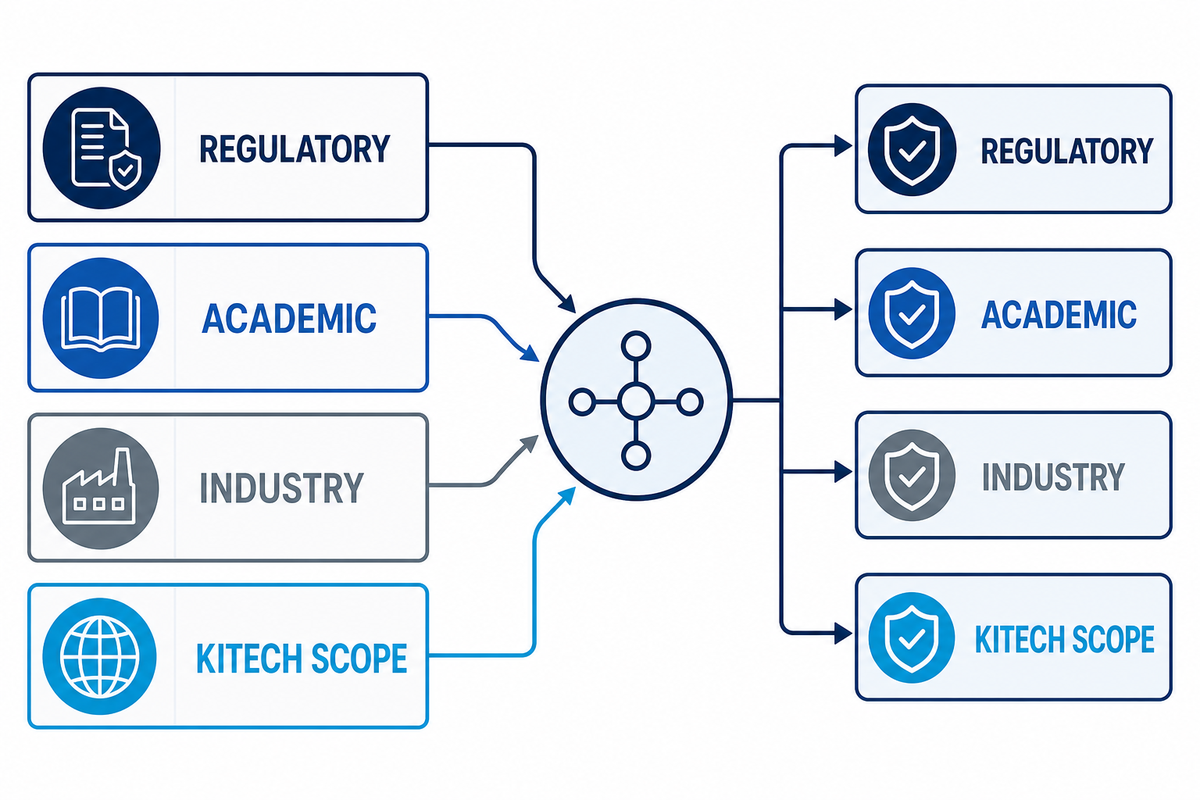
This guidance uses third-party technical, regulatory, academic, and industry sources for process and technology limits. Kitech pages are used only to define the site’s solution scope and the appropriate next step.
- Association of Plastic Recyclers: Near Infrared Sorting of Whole Rigid Packages
- Association of Plastic Recyclers: The Plastic Recycling Process
- Assessment of Performance and Challenges in Commercial Automated Sorting
- Detection of Black Plastics in the Middle Infrared Spectrum
- Sink-Float Density Separation of Post-Consumer Plastics
- Environment Agency: WEEE Treatment Appropriate Measures
- FDA: Recycled Plastics in Food Packaging
Boundary note: Actual recovery, purity, throughput, utility demand and equipment configuration depend on representative feed analysis and supplier trials. This article doesn’t state a Kitech performance guarantee.
Related Posts
Trending now