Get in touch with Kitech Company
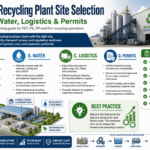
Plastic recycling plant site selection is the decision that quietly set your operating cost for the next 20 years. Pick the right ground and feedstock arrives cheaply, the grid carries your load, and permits clear on schedule. Pick wrong and you spend the plant’s whole payback window trucking bales across three states, fighting a zoning board, or discovering the transformer on the property can’t start a 200 kW shredder. This guide turn that decision into a scored, repeatable process.
Below you’ll find the nine factors that actually move the numbers, a weighted scorecard you can copy to rank candidate sites, and real utility, cost, and regulatory data, drawn from peer-reviewed siting research, U.S. EPA case studies, and the field experience of building recycling lines in more than 80 countries.
Site Selection at a Glance
- Top cost driver, feedstock supply and proximity, the largest recurring operating variable when raw material has to be hauled in
- Typical land need, roughly 0.5–2 hectares (≈1.2–5 acres) for a 1,000–3,000 kg/h recycling facility, including bale storage and finished-pellet storage
- Utility load on a 1,000 kg/h PET wash line, industry suppliers report ~215–300 kW installed and ~25 m³/h water
- Hidden site cost, civil works, drainage, power and water hookups, and commissioning routinely add up to roughly the equipment list price again
- Regulatory pressure in 2026, EU PPWR applies from 12 Aug 2026, and 7+ U.S. states now have packaging EPR laws
What this guide covers
- Why the site decides whether the plant succeeds
- The 9 core criteria, the Site Selection Scorecard
- Feedstock proximity and the collection radius
- Utilities: power, water and wastewater
- Land size and plant layout
- Permits, zoning and community fit
- Logistics and proximity to end markets
- Labor, cost and total site investment
- Common site selection mistakes
- Industry outlook: how EPR is redrawing the map
Why Site Selection Decides Whether a Plastic Recycling Plant Succeeds
Every plastic recycling plant is a feedstock-in, pellets-out business with thin margins and heavy fixed assets. Location fixes three of your largest line items before you ever buy a shredder: what you pay to bring waste in, what you pay for power and water to process it, and what you pay to move finished pellets to a buyer. Equipment can be upgraded; a bad site can’t be relocated without scrapping the investment.
Consider the economics. Complete turnkey lines run from about $150,000 to well over $2,000,000 depending on throughput and waste stream, and the industry rule of thumb is an 18–36 month payback. That payback assumes feedstock keeps flowing at a stable price and the plant run at rated uptime. Site selection is what protects both assumptions. If your nearest reliable bale supply sits 400 km away, freight can erase the margin that the equipment was sized to deliver, and no amount of mechanical efficiency buys it back.
This is also why the topic has attracted serious academic attention. Peer-reviewed studies now model recycling plant site selection as a formal multi-criteria decision problem, weighting and ranking candidate locations with GIS and analytical methods rather than gut feel. One 2026 study in Environmental Innovation and Societal Transitions frames site selection for a plastic recycling plant within a circular economy as exactly this kind of weighted, criteria-driven assessment. For a plant owner the lesson is simple: treat siting as a scoring exercise, not a real-estate hunch.
💡 Key takeaway
Location locks in your feedstock, energy, and logistics costs for the life of the plant. Score it before you sign anything — the next section gives you the scorecard.
The 9 Core Site Selection Criteria: The Site Selection Scorecard
Every credible siting decision weighs the same family of factors; what differs is how heavily each one count for your material and market. Below is a weighted scorecard you can copy. Rate each candidate site 0–5 on every factor, multiply by the weight, and total the column. The site with the highest weighted score is your front-runner, and the math show you why, which is far more defensible to a lender or board than “it felt right.”
| Factor | Weight | What a “5” looks like |
|---|---|---|
| Feedstock supply & proximity | 20% | Reliable bale supply within a short haul; contracted volumes |
| Utilities (power, water, drainage) | 15% | Three-phase capacity to spare, matching voltage/frequency; water supply and legal effluent route |
| Logistics & transport access | 12% | Direct highway interchange; rail or port option for export |
| Zoning & permitting feasibility | 12% | Land already zoned heavy/industrial; clear discharge permit path |
| Total site cost (land + civil works) | 12% | Buildable, level, drained ground at a price that keeps payback intact |
| Labor availability & cost | 10% | Local pool of operators/maintenance at a sustainable wage |
| Proximity to end markets | 8% | Pellet buyers (converters, compounders) within economic freight range |
| Environmental & community fit | 6% | Buffer distance from homes/schools; low odor and noise conflict risk |
| Expansion room & utility headroom | 5% | Spare land and spare power/water for a second line |
These weights are a starting point, not gospel. What’s honest about this framework is that it forces you to declare your priorities. Reclaimers of post-consumer PET, who live and die on consistent bottle bales, may push feedstock to 25%. Film recyclers exporting pellets may raise logistics and end-market weight. Academic siting models do the same thing more formally, GIS multi-criteria studies assign and test weights across exactly these dimensions, including a measurable penalty for proximity to schools and residential areas, which they call social opposition mitigation.
“The factor that sinks first-time projects is almost never the machine, it is the site. We issue a utility requirement list at contract signing precisely so the customer can pre-qualify the ground for power, water, and drainage before the line ships. A site that scores well on paper but cannot land a transformer on time delays commissioning by months.”
Feedstock Proximity: Locate Near a Reliable Plastic Waste Supply
Feedstock is the single largest recurring cost in most recycling operations, and it’s the factor a good site protect best. Plastic waste is bulky and low in value per truckload until you’ve processed it. Hauling loose or baled material long distances burns margin fast, so the economic catchment of a plant, the radius within which feedstock is cheaper to collect than to import, defines its viability before any machine runs.
This is why peer-reviewed siting models put collection and transportation cost at the center of the calculation. One 2025 study building a GIS-based framework for waste processing location and cost treats feedstock collection and transport as primary cost parameters alongside capital and operations. The U.S. EPA’s case-study work on manufacturing from recyclables reaches the same practical conclusion: where and how feedstock is collected sets the delivered price, and the delivered price sets the business case.
There’s a supply-side trap here that catches newcomers. Consultancy analysis of the fight for recycled feedstock points out that recovered-plastic supply is limited not by plant capacity but by local collection and sorting rates. In other words, a region can look feedstock-rich on paper while almost none of it actually reaches a recycler in usable condition. So what? Score a site on contracted, sorted, accessible tonnage, not on how much plastic the region theoretically discards.
Consider a real comparison. An investor evaluated two parcels for a 1,000 kg/h PE film line. Parcel A sat in an industrial park 30 km from three large agricultural-film collection points with signed offtake. Parcel B was cheaper land but 250 km from any organized film stream, relying on spot purchases. On the scorecard, Parcel B’s lower land price gained two points on cost, but lost four on feedstock, because spot film at variable contamination meant unpredictable wash yields. Parcel A won, and the difference was almost entirely freight and yield, not the machine.
💡 Pro tip
Map your feedstock before your factory. Plot every reliable collection source, estimate delivered cost per tonne for each candidate site, and weight feedstock heaviest on the scorecard. Local contamination levels also dictate your wash configuration — see how friction and hot-wash plastic washing systems are matched to dirtier streams.
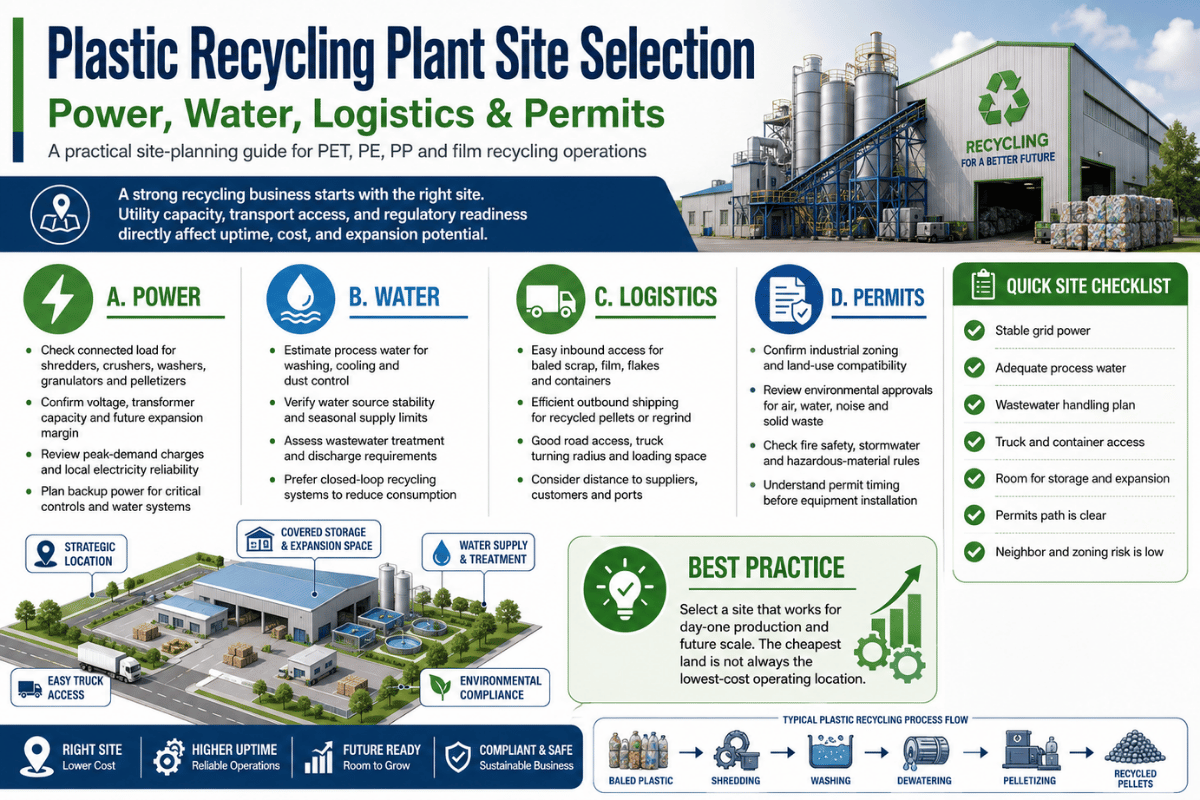
Utilities and Infrastructure: Power, Water and Wastewater
Recycling lines are energy- and water-hungry, and “the grid is nearby” isn’t the same as “the grid can carry my load.” This factor fails sites quietly: the land looks fine until the utility study reveal the service transformer can’t start large motors, or the only legal route for wash effluent is a treatment plant that won’t accept it.
Start with concrete numbers. Shredders alone draw anywhere from about 15 kW for light film grinding to 200 kW for heavy-walled HDPE drums and rigid casings. For a complete wash line, industry suppliers report that a 1,000 kg/h PET bottle washing line carries roughly 215–300 kW of installed power and consumes on the order of 25 m³/h of water, with hot-caustic washing run at 60–85 °C. Treat those as planning figures, not guarantees, actual draw depends on automation level, drying method, and how much water you recirculate.
📐 Engineering Note: Pre-qualifying a site’s utilities
- Power: confirm three-phase service with headroom above installed kW, and confirm voltage/frequency. Equipment is built to either 50 Hz or 60 Hz and a specific voltage, a mismatch means costly conversion. A 1,000 kg/h wash line needs a service comfortably above its ~215–300 kW installed load to handle motor inrush.
- Water: size make-up water for ~25 m³/h class lines, then design recirculation to cut net draw. Confirm the site can physically supply peak flow.
- Wastewater: wash water carries dirt, labels, adhesives and fines. Confirm a legal discharge route, municipal acceptance, on-site effluent treatment, or closed-loop, before buying the land, not after.
- Drainage and foundations, heavy machinery and standing wash water demand graded, drained slabs. Budget civil works as a real line item.
The “available versus ready” gap is a documented pitfall. Trade analysis of site selection for the plastics industry warns that even where a utility line is close, creating a direct, adequate connection can cost far more than expected once easements and upgrades are counted. One practical move: get a written utility capacity statement for each candidate site during evaluation. On Kitech projects, the utility requirement list is issued at contract signing so a buyer can run civil and electrical works in parallel with the 60-day build and hit a firm commissioning date rather than a guess.
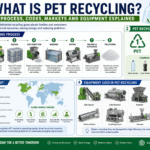
For deeper figures on how wash and pelletizing stages drive energy demand, the academic literature on energy consumption in plastic recycling is a sound, vendor-neutral reference; our own complete PET recycling process guide walks through where the load actually go, stage by stage.
Land Size and Plant Layout Requirements
How much land you need is a function of throughput and storage, not just the footprint of the machines. The processing line itself is relatively compact and linear, a 1,000 kg/h PET wash line spans on the order of 90 metres end to end but the storage on either side is what eats acreage. You need room for inbound bales (often weeks of buffer to ride out feedstock swings) and for finished pellets or flake awaiting shipment.
As a planning band, a 1,000–3,000 kg/h line with sensible storage typically wants roughly 0.5–2 hectares (about 1.2–5 acres). Lay the site out around the process flow, because material should move in one direction without backtracking:
Recommended layout flow (one-directional)
- Inbound & bale storage — covered area sized for weeks of feedstock buffer
- Size reduction — shredding/granulation to 10–50 mm
- Washing & separation — friction, hot wash, float-sink; nearest the wastewater handling
- Drying — centrifugal/screw-press to below 3% moisture
- Pelletizing — extrusion with melt filtration
- Finished-product storage & dispatch — silos/bagging near the truck dock
Leave deliberate expansion room. Among reclaimers who outgrow a site, the most common regret is buying exactly enough land for line one, then having nowhere to put line two when demand or feedstock grows. A parcel that score a quiet point higher on “expansion room” today can save a full relocation later. If you’re still sizing the line itself, the interactive recycling line selector maps material and capacity to a configuration, which in turn fixes your land and utility math.
Permits, Zoning and Community Fit
Zoning and permitting can add months, or kill a site outright, so screen it early. Two questions matter first: is the parcel zoned for heavy or industrial use, and is there a clear, legal path to discharge or treat wash water? Cheap parcels zoned light-commercial that need a rezoning fight is rarely cheaper than buildable industrial land once you price the delay.
Land-use compatibility is a formal criterion in the academic siting literature, not just a regulatory box. GIS-based studies of siting plastic recycling plants weight compatibility with surrounding land use and distance from sensitive receptors as core suitability factors. That academic framing maps directly onto a real-world risk: community opposition. Wash lines can generate odor, noise, and truck traffic, and siting too close to homes or schools invites the kind of permitting fight that the research literature explicitly models as a penalty.
Here’s how that plays out. One developer optioned an inexpensive parcel on the edge of a residential district, reasoning that the land cost saved would cover any objections. Public hearings stretched the permit timeline past a year as residents raised odor and noise concerns; the carrying cost on the idle investment and the delayed payback wiped out the land savings several times over. Buffer distance that would have cost a few points on land price would have saved the year.
Build a permit checklist per candidate site: zoning classification, environmental/discharge permits, air and noise rules, and any local recycling or waste-handling licenses. Industry-association resources such as the Association of Plastic Recyclers publish design and operating guidance that helps anticipate what regulators will ask.
Logistics and Proximity to End Markets
Every site forces a trade-off between being close to feedstock and being close to pellet buyers. You can’t always have both, so the scorecard make you weigh which freight leg is more expensive for your material. The deciding insight: you ship finished pellets at a premium, while you collect raw feedstock at low value per load. Recycled pellets typically command a 20–40% premium over flake, and pellet is denser and more shippable than baled waste, so it’s usually cheaper to move the value-added product farther than to truck loose feedstock long distances.
What this means in practice: for most operations, weight feedstock proximity above end-market proximity, and lean on transport infrastructure to reach buyers. Highway access is the baseline; rail and port access matter if you export. Plastics freight moves at scale, roughly 100 million tons of plastic resin move by U.S. freight rail each year, about 30% of the industry, across a 140,000-mile network, according to the Association of American Railroads. But finding an industrial parcel with direct rail connectivity is genuinely hard, so verify it rather than assume it.
Feedstock-led vs market-led siting — which fits you?
- Feedstock-led (most reclaimers): variable, contamination-sensitive input (PET bottles, ag film). Sit near collection; accept longer pellet haul. Weight feedstock 20–25%.
- Market-led (toll compounders, captive supply): stable contracted feedstock but specific converter customers. Sit near buyers; weight end-market 12–15%.
Labor, Cost and Total Site Investment
Two factors close out the scorecard: can the area staff the plant, and what does the whole site really cost? Labor is easy to underestimate. In the broader plastics sector, labor can reach up to 80% of operating cost, and wages vary widely by region. A recycling line need operators, maintenance technicians who can keep shredders and extruders running, and supervisors who understand wash chemistry. Pick a remote, ultra-cheap parcel that can’t staff a second shift and you’ve bought a false economy.
Then there’s the cost most first-time investors miss: the site isn’t the machine. Equipment is only part of the bill.
| Equipment type | Capacity range | Typical investment |
|---|---|---|
| Plastic shredder | 300–3,000 kg/h | $3,000 – $100,000 |
| Washing line (film) | 300–1,000 kg/h | $80,000 – $250,000 |
| Washing line (PET bottles) | 500–3,000 kg/h | $180,000 – $600,000 |
| Pelletizing system | 200–3,000 kg/h | $30,000 – $250,000 |
| Complete turnkey line | 500–3,000 kg/h | $150,000 – $2,000,000+ |
Equipment investment bands, 2025–2026; figures vary with configuration and automation.
On top of equipment, budget for civil works (foundations, drainage), electrical infrastructure, water management, sorting, spare parts, and commissioning with operator training. As a planning rule, expect total project cost to land near twice the equipment list price. So what? When you compare sites on cost, compare total delivered project costland plus civil works plus hookups, not the sticker price of the line. A parcel that need a new access road, a transformer upgrade, and an effluent plant isn’t the cheap option it appears to be.
Common Site Selection Mistakes (and How to Avoid Them)
These failure modes repeat across projects, and most trace back to scoring one factor in isolation instead of the whole site. Engineers and operators discussing recycling economics in forums such as r/AskEngineers return again and again to the same reality: the technology is rarely the bottleneck; feedstock quality, contamination, and the local economics are. Peer-reviewed work on the challenges and opportunities of plastics recycling echoes it: the economics turn on collection, contamination, and end-market access, all of which the site governs.
- ⚠️ Chasing cheap land over feedstock. A low purchase price never recovers a structural freight disadvantage on inbound waste.
- ⚠️ Confusing utility availability with utility readiness. A nearby line that can’t start your motors, or accept your effluent, isn’t a utility you’ve.
- ⚠️ Ignoring power voltage/frequency. Equipment built for 50 Hz at one voltage won’t simply run on a 60 Hz service, confirm the match before you site.
- ⚠️ Siting next to homes or schools. Odor, noise, and truck traffic turn into permit delays the research literature predicts.
- ⚠️ No room for line two. Sizing land for today’s throughput forces a relocation the moment you grow.
Industry Outlook: How EPR Is Redrawing the Map for Recycling Plants
Site selection used to be mostly about cost and feedstock geography. Through 2026 and beyond, regulation is becoming a third axis, and it changes where building a plant pays. Driving it’s the global wave of extended producer responsibility (EPR) and recycled-content rules, which are creating durable, mandated demand for recycled pellets in specific regions.
In the European Union, the Packaging and Packaging Waste Regulation (PPWR 2025/40) entered into force on 11 February 2025 and applies generally from 12 August 2026, setting recycled-content and recyclability targets that pull demand toward domestic recyclers. In the United States, packaging EPR has moved from idea to law in at least seven states, with Washington’s WRAP Act adopted in May 2025 joining California, Oregon, Colorado, Maine and others; the Association of Plastic Recyclers’ EPR policy hub tracks the expanding map.
What this means for siting. EPR programs fund collection and create recycled-content mandates, which tighten the link between where waste is collected and where compliant recycled material must be supplied. If you’re planning a 2026–2028 project, factor the regulatory map into the scorecard: a site inside an EPR jurisdiction with funded collection and mandated demand may justify a higher land or labor cost than a cheaper site in an unregulated region, because the policy underwrites both your feedstock supply and your pellet market. The supply bottleneck remains collection and sorting, so the strategic site sit where funded collection meets mandated demand.
⚠️ Action for 2026 planners
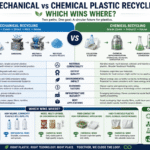
Before you finalize a site, check the EPR and recycled-content status of the jurisdiction. A location that scores one point lower on land cost but sits inside a funded EPR system can out-earn a cheaper, unregulated parcel over the plant’s life. Whether mechanical or chemical recycling fits your feedstock also shifts with policy — our breakdown of mechanical vs chemical plastic recycling covers where each wins.
Frequently Asked Questions
Q: How do you choose a location for a plastic recycling plant?
View Answer
Score candidate sites against weighted criteria rather than picking on instinct. The nine that matter most are feedstock supply and proximity, utilities (power, water, drainage), logistics, zoning and permitting, total site cost, labor, end-market proximity, environmental and community fit, and expansion room. Rate each site 0–5 per factor, multiply by the weight, and total the columns. Weight feedstock and utilities heaviest, because they drive your largest recurring costs and they are the hardest to fix once you have built. The value of scoring is that it makes the trade-offs explicit: when a cheap parcel loses four points on feedstock to gain two on land price, the math tells you to walk away. It also gives a lender or board a defensible reason for the choice, which matters when you are asking them to underwrite a seven-figure line.
Q: How much land do you need for a plastic recycling plant?
View Answer
As a planning band, a 1,000–3,000 kg/h line with sensible inbound bale storage and finished-pellet storage typically wants roughly 0.5–2 hectares (about 1.2–5 acres). The processing line itself is compact and linear — a 1,000 kg/h PET wash line is on the order of 90 metres long — but feedstock and product storage drive the real footprint. Always leave deliberate expansion room for a second line.
Q: How much power and water does a plastic recycling line use?
View Answer
It depends on the line, but as planning figures, industry suppliers report a 1,000 kg/h PET washing line at roughly 215–300 kW installed power and about 25 m³/h of water, with hot-caustic washing at 60–85 °C. A shredder alone ranges from about 15 kW for light film to 200 kW for heavy rigids. Confirm three-phase capacity with headroom, matching voltage and frequency, and a legal wastewater route for your specific configuration before committing to a site.
Q: What permits are needed for a plastic recycling plant?
View Answer
Requirements vary by country and locality, but a typical checklist includes industrial-zoning approval, an environmental or wastewater discharge permit, air and noise compliance, and any local waste-handling or recycling license. Screen zoning and the discharge path first — these are the two that most often kill or delay a site. Industry-association design guidance helps anticipate regulator expectations.
Q: How close should a recycling plant be to its feedstock supply?
View Answer
Close enough that delivered feedstock cost keeps your payback intact — feedstock is usually the largest recurring cost, and waste is bulky and low-value to haul. Rather than a fixed radius, score sites on contracted, sorted, accessible tonnage within an economic catchment. Regions can look feedstock-rich while little usable material actually reaches a recycler, so base the decision on secured supply, not theoretical waste volumes.
Q: What is the payback period for a plastic recycling plant?
View Answer
Industry benchmarks point to an 18–36 month payback, but that range assumes stable feedstock cost, good uptime, and a buyer for your pellets — all of which the site governs. A poor site lengthens payback no matter how efficient the machine.
Q: Should the plant be closer to feedstock or to pellet buyers?
View Answer
For most reclaimers, favor feedstock. Finished pellets are denser, more valuable, and cheaper to ship than baled waste, so it is usually more economical to move the value-added product farther than to truck loose feedstock long distances. Market-led siting (closer to buyers) makes sense only when you have stable contracted feedstock and specific converter customers.
Pre-qualify your site before you build
Send us your target throughput and material, and our engineering team will return a utility and layout requirement list, so you can score candidate sites on power, water, drainage and footprint before committing. Quotes within 48 hours of material analysis.
Why We Wrote This Guide
Kitech designs, builds, and commissions plastic recycling lines in more than 80 countries, and the questions buyers ask us about power, water, drainage, and 50/60 Hz compatibility shaped every section above. The utility and cost figures here are the same ones we hand customers as a requirement list at contract signing; the regulatory and academic points are cited to public sources so you can check them against your own jurisdiction.
References & Sources
- Site selection for plastic recycling plant in a circular economy — Environmental Innovation and Societal Transitions (2026)
- A GIS-based framework for waste processing location and cost analysis — Journal of Cleaner Production (2025)
- GIS-based site selection for plastic waste management in agriculture — Resources, Conservation & Recycling (2025)
- Manufacturing from Recyclables: 24 Case Studies — U.S. Environmental Protection Agency
- Packaging and Packaging Waste Regulation (PPWR 2025/40) — European Commission
- Plastics recycling: challenges and opportunities — Philosophical Transactions of the Royal Society B (PMC)
- EPR for Packaging Laws — Association of Plastic Recyclers (APR)
- The fight for recycled feedstock — Kearney
- Site Selection Considerations for the Plastics Industry — Trade & Industry Development