Get in touch with Kitech Company


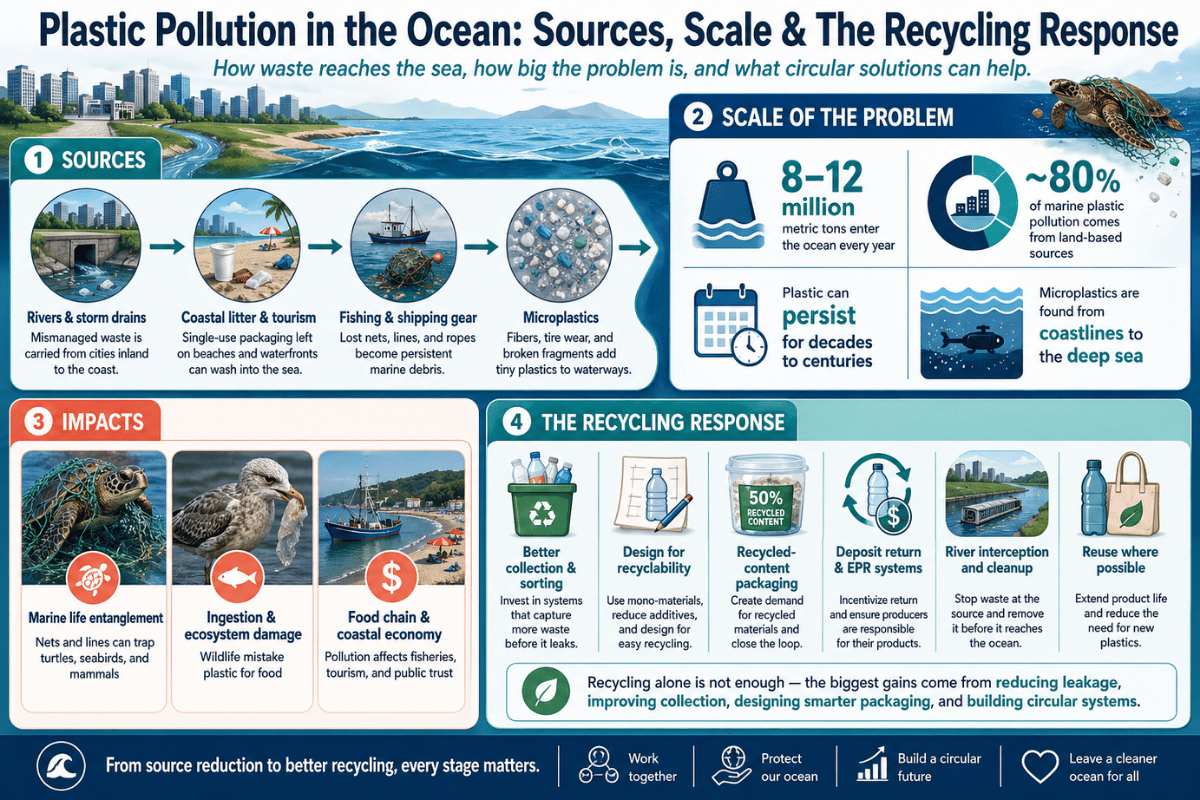
Plastic pollution in the ocean has become the visible face of a much larger industrial-waste problem that is, in fact, largely invisible. About 1-2 million metric tons of plastic enter the ocean every year – representing a mere 0.5% of total plastic waste produced – still that tiny proportion is enough to drift through every ocean basin, accumulate in five subtropical gyres, and turn up in the tissues of seabirds, fish, and humans.Figures in this guide are derived from peer-reviewed literature and the OECD’s Global Plastics Outlook 2022, not advocacy material. Popular numbers (the so-called “8 million tonnes a year”, the “10 rivers cause 90% of the problem” claim), we have clarified or replaced; in doing so we mention it, so that the closing question does not go unmentioned: if cleanups can recover only a small share of what is in the ocean already, what closes the leak – and where does industrial recycling capacity fit that answer?
Quick Specs — Ocean Plastic Pollution by the Numbers
| Annual plastic entering the ocean | 1–2 million metric tons (≈0.5% of all plastic waste) |
| Land-based share of ocean plastic | ~80% (rivers carry the bulk; sea-based ~20%) |
| Great Pacific Garbage Patch | ~1.8 trillion pieces of plastic · ≈100 million kg floating mass |
| GPGP plastic from fishing activities | ~80% of identifiable hard plastic (Lebreton et al. 2022) |
| Plastic ever recycled (cumulative) | ~9% globally (OECD 2022) |
| Top 5 country emitters | Philippines, India, Malaysia, China, Indonesia (≈70% combined) |
The references: Our World in Data 2023; OECD Global Plastics Outlook 2022; Lebreton et al. 2018, Scientific Reports.
How Much Plastic Is in the Ocean? Putting the Numbers in Order
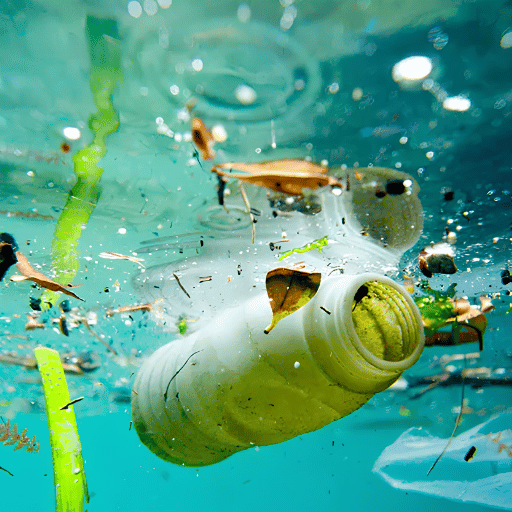
Honestly, the answer is that between 1 and 2 million tonnes of plastic enter the ocean a year, based on the OECD global plastics Outlook 2022, and the modelling work that Our World in Data cites to summarize the category. the world produces around 350-400 million tonnes of plastic waste every year; around 0.5% of that reaches the ocean. Eliminating plastic use at source – and ramping up recycling capacity to consume what we continue to produce – is the structural answer to ocean plastic pollution, not the cosmetic one.
So, why have you “heard” 8 million tonnes a year for nearly ten years? That figure is derived from Jambeck et al., Science, 2015 – the first global estimate. This was a pioneering paper, but subsequent research has altered the figures downward. Borrelle et al., in a subsequent paper in the journal Science in 2020, found that 11% of plastic waste, or roughly 19-23 million metric Tons, entered aquatic ecosystems in 2016 – but this calculation accounts for rivers, lakes, and coastal areas, not solely the open ocean. For the narrower “open ocean” estimation, after accounting for plastic that sink, wash up on the shores, or are trapped on river banks, the range appears to be 1-2 million tonnes per year.
How much plastic enters the ocean each year?
Hence three efforts, three varying assessments – all referring to that phase of how many tonnes of plastic enter the system has achieved before they reach in the open seas:
| Study | Figure | What it actually measures |
|---|---|---|
| Jambeck 2015 (Science) | ~8 Mt/yr | First global estimate, coastal mismanaged-waste flow into ocean |
| Borrelle 2020 (Science) | 19–23 Mt/yr | All aquatic ecosystems (rivers + lakes + ocean), 2016 baseline |
| OECD 2022 / OWID 2023 | 1–2 Mt/yr | Plastic actually reaching the open ocean after losses in rivers and on coastlines |
Three numbers, three meanings — not in contradiction. They are indicative of different indicators. When a policy paper or a media magazine refer to “ocean plastic”, the OECD/OWID 1-2 Mt value is the one that can be compared to current peer-reviewed records – but the broader Borrelle range matters, because most of that 19-23 MT is leaking into the fresh waters that feed the ocean.
💡 Pro Tip — for procurement and ESG teams
Simply putting 8 Mt/yr in a 2026 sustainability report will be flagged. Ring in 1–2 Mt/yr for ocean entry, and call up the OECD global plastics Outlook as your methodological anchor.
Where Does Ocean Plastic Come From? The Top Sources Explained
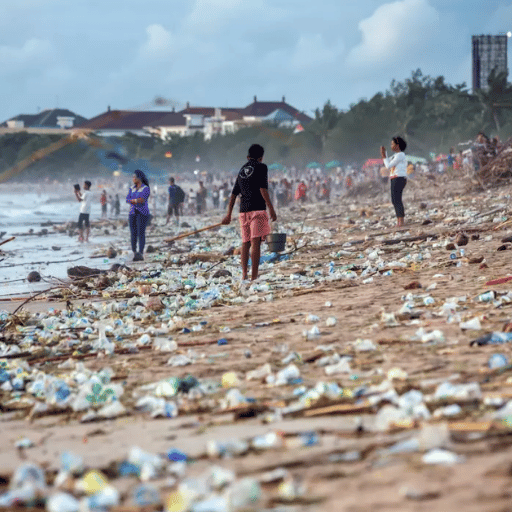
About 80% of ocean plastic originates on land, flushes or seeps into the sea on rivers, urban drainage, or direct coastal dumping. Sea-based sources contribute the remaining ~20% — fishing gear, shipping waste, aquaculture shedder. That split has policy-relevance because it tells you which place intervention dollars do the most work per ton averted.
Land-based sources: rivers and mismanaged waste
For a long time the headline claim was that “10 rivers carry 90% of ocean plastic”. A 2021 study by Meijer et al. in Science Advances recalculated using higher-resolution land-use data and found a different picture: over 1,000 rivers account for 80% of global riverine plastic emissions to the ocean. Pollution is far more distributed than the original claim suggested, which has policy implications – there is no small number of choke points to clean up.
By country, around 70% of riverine plastic emissions come from five places: the Philippines, India, Malaysia, China, and Indonesia. Residents in those countries do not necessarily produce more plastic waste per capita than Americans or Europeans (Americans produce roughly four times as much per person as the average Indian, per OWID). What they have less of is functional waste-collection infrastructure. plastic pollution is mostly a waste-management problem, not a consumption problem – once you separate the two metrics, the geography flips.
Storms and heavy rain can spike emissions. Research published in Environmental Research Letters documented that plastic flows into rivers can increase as much as tenfold during storm events. Most plastic debris doesn’t sit politely on a river bank; it moves in the events that happen to wash everything else into the sea, too. Packaging fractions – single-use plastic bags, food wrappers, beverage containers – dominates by piece count, even where mass is dominated by sturdier items.
Sea-based sources: fishing gear and shipping
Sea-based slice is small in tonnage but disproportionate in two ways. First, sea-emitted plastic stays at sea – it doesn’t beach within a month the way most river-borne plastic does. Second, fishing gear is engineered to be durable and to catch animals – exactly the wrong properties when it goes adrift.
The FAO/UNEP analysis of abandoned, lost, or otherwise discarded fishing gear (ALDFG) places annual losses at roughly 640,000 tonnes globally. Industry practitioners commonly note that storm gear loss is the dominant mechanism – not deliberate dumping. Trawlers caught in heavy weather often must cut nets free to save the vessel, and seabed snags force fishers to abandon gear that would otherwise destroy a hauler. Operators in temperate fisheries treat this as a structural cost of operation, not an avoidable error.
What is the largest source of plastic in the ocean?
In other words, worldwide, mismanaged municipal plastic waste in coastal middle-income countries contributes the most to ocean plastic emissions (most of it transits through rivers southeast Asia). Nevertheless, within specific accumulation zones like the Great Pacific Garbage Patch (GPGP), fishing gear is the main input; both statements hold simultaneously, and both describe different stages of how waste journeys toward those garbage patches.
The Great Pacific Garbage Patch — Myth vs. Reality

The GPGP is not an island: it is a soup – about 80 percent of its identifiable, hard ocean by weight is fishing gear, not the shopping bags consumers were told to feel guilty about (SDGTarget 12.3). That makes the re-sponsibilities for a solution very different.
Five gyres, one famous one
The GPGP is a result of five subtropical ocean gyres: the North Pacific, South Pacific, North Atlantic, South Atlantic and Indian Ocean gyres. They are slow rotating current systems that hold buoyant debris for decades. North Pacific gyre (where the GPGP is situated between Hawaii and California) is the most important because it is the most polluted.
What’s actually in the patch
The most quoted measurements are by Lebreton et al. Scientific Reports, 2018: about 1.8 trillion tiny ocean pieces, weighing approximately 100 million kg (hence the initial 79,000 tonne estimate has been adapted upwards in later surveys). Some 92 percent by weight comprise large objects, Microplastic exist mostly as misreported by count – and Microplastic by weight are only 8 percent, microplastic by count dominate: the external surface area. Roughly twice the size of Texas, but all-in-all, as the Ocean cleanup Foundation explains, it is a ‘plastic soup’, not a concrete mass.
‘Most plastic travelling in coastal waters originate from land-based sources, but the GPGP is an exception. Approximately 80% of plastic in the GPGP originates from fishing-related activities at sea.’
— Laurent Lebreton, lead oceanographer, The Ocean Cleanup; co-author of the 2018 and 2022 GPGP composition studies
That share arises from the way plastic behave. Floating items escaping from rivers tend to beach inside about a month of escape (most coastal plastic reach the shore quite rapidly). Discards caused by fishing at sea, however, are emitted far from the coast and frequently consist of designed to last in saltwater materials like HDPE rope, polypropylene floats and polyamide fishing nets. Buoyancy (are specific gravities less than one) persists in the marine environment, leading those items to reach gyres.
📐 Polymer Note — why bottle caps outlast bottles
A fishing net, discarded at sea: its specific gravity may be greater than 1 (it will sink once wetted), but its components individual item will usually be less than. Polyamide floats but the net will sink, serving as both a sink and source. Likewise, the specific gravity of the PET bottle cap (0.95) is less than 1. It will float, whereas the bottle (1.38) will sink. This is part of the explanation as to why GPGP archives of bottle caps are larger than bottles, and why polymer-specific recycling options matter. HDPE, PET and PP each behave differently in the environment and in recycling.
Microplastics — The Invisible Crisis
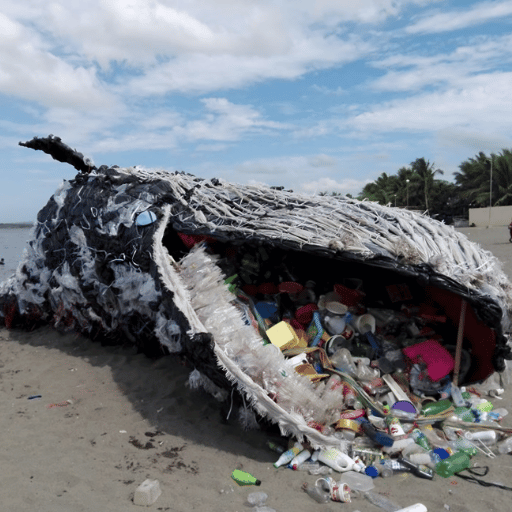
Microplastics are particles smaller than 5 mm and comprise microbeads manufactured in that size (found in cosmetics), preproduction pellets called nurdles and virgin powder used industrially (reach the ocean)…or secondary microplastic, formed when larger objects break down under the influence of sun, abrasion and microbial decay;
The top sources are not what most people guess
Most media coverage addresses cosmetic microbeads and single-use packaging. More significant primary microplastic sources are: 1. manufacturing and 2. ingestion, and these differ from the commonly discussed. As summarized in the OECD policy paper on microplastics and the IUCN 2017 report on primary microplastics, the two highest sources are:
- ✔
Tire wear particles — synthetic rubber and plasticisers that abrade off tires every time a vehicle moves; estimated to be the single largest contributor of primary microplastics in the marine environment. - ✔
Synthetic textile fibers — polyester, nylon, acrylic shed during washing, especially in domestic laundry. A single wash cycle can release hundreds of thousands of fibers. - ✔
City dust, road markings, marine coatings — secondary contributors that add up.
How do microplastics get into fish?
Microplastics enter the marine food web at its base. Zooplankton ingest particles roughly the same size as their natural prey; one peer-reviewed study found that zooplankton fed microplastic consumed about 40 percent less carbon biomass, with downstream knock-on effects on growth and reproduction. Fish eating zooplankton accumulate that load. Larger predators eating those fish accumulate more. By the time you reach commercial species — sardines, anchovies, tuna — microplastic detection has become routine rather than exceptional.
Great Pacific Garbage Patch surface holds roughly 180 times more plastic by mass than zooplankton biomass, per Ocean Cleanup peer-reviewed measurements. For filter-feeders inside the patch, plastic is statistically more available than food. Long-term effects on marine populations remain an active research question, not a settled one.
⚠️ What we don’t yet know
The ingestion of microplastic by humans is now documented (see the next section), but long-term effects on our health are not fully understood. Forthcoming surveys show what we are able to measure today, share what we know and point out the knowledge gaps; experts refrain from making claims about the impacts we are unable to define.
Wildlife and Human Impact — From Sea Turtles to Bloodstreams

The cost impacts of ocean plastic to in vivo biology are measured by three factors: entanglement in fishing gear, ingestion and poisoning.
Entanglement and ingestion — 914 marine megafaunal species affected
A peer reviewed review by Khn and van Franeker in Marine Pollution Bulletin identified 914 megafaunal species (fish, marine mammals, turtle seahorses, seabirds, crustaceans) with evidence of plastic ingestion or entanglement. Over 100 of these are listed as threatened, while ghost gear is the leading cause of entanglement: nets and ropes intended not to break during a fishing operation don’t break around an animal either.
A real life example represents the issue. Mediterranean monk seals (Moshus monachus) – one of the most endangered semi-aquatic species – is succumbing to two causes; the first is doing it voluntarily, by fishermen (their catches are of more concern to them) and the latter is its own problem: the contact of a very well-established fishing-fleet in the North Aegean Sea with the seal’s own floating body, is ‘another’ cause of its extinction. Latter could obviously be the more significant as today, the population is less than 700 individuals!
Microplastics in human tissues
Microplastic has shifted from “out there” to “inside” in the last 4 years. Leak et al. 2022 in Environment International were the first group to find plastic particles in human blood: 17 of 22 volunteers subject to the test were positive (detection rate of 77%). Later peer reviewed work has also detected microplastic in human lungs, placenta, breastmilk, testicular tissue, and brain. A 2024 follow up study saw microplastic present in 88.9% of blood samples of the test group.
Three points worth noting honestly:
- Detect harm. At presently measurable concentrations in human tissue, whether chronic disease is being caused is still not known.
- Most microplastic results in other than ocean seafood (tap water, house dust, other food items used in the diet) while ocean is one of many paths.
- Growth pathway is critical. At low effect sizes, long-term calculations must take into account the exponential effects of decades of biological exposures.
Economic cost
Vhedki plastic pollution erodes the value of all marine-centric ecosystem services fisheries, tourism, coastal protection, sequestered carbon by between $500 billion and $2.5 trillion per year (Beaumont et al., 2019). Whatever the actual number, ocean plastic remains a recurring tax on economies that have ocean-dependent marine systems.
Why Beach Cleanups Aren’t Enough — The Recycling Response
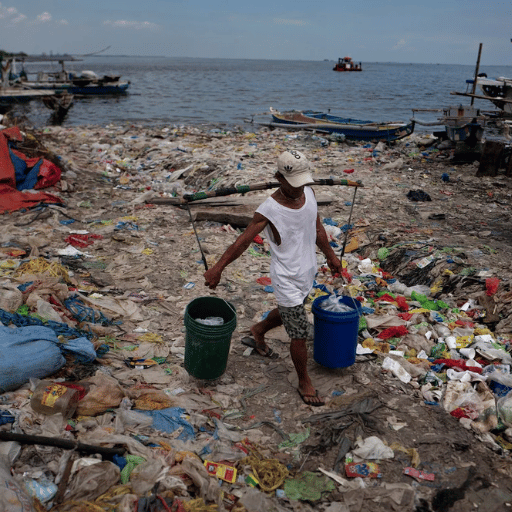
Imagine the Delfund. Turn off the tap, or mop the floor. Most public attention on ocean plastic involves mopping: beach cleanups, bottle-collection events, ocean-cleanup robotics. Necessary, photogenic, affording direct action; constrained by physics. Volumes produced are constrained by physics. Closing the tap involves plastic production, poor waste management, and a significant increase in recycling capacity. Turning off the tap is what shifts the curve.
Beach cleanups and ocean technology — necessary but small
Volunteer beach cleanups recover on the order of 0.05-0.1% of total post land-to-ocean flow on global scale. Ocean Cleanup’s offshore systems reclaim plastic that is currently in the gyres; their peer-reviewed environmental assessment shows net benefit, but their system targets legacy plastic rather than ongoing emissions. Cleanup can prove lessons and build awareness, but existing systems cannot counter annual inputs by design.
Mechanical recycling capacity gap
According to the OECD’s global plastics Outlook 2022 one “9%” has been recycled; ~22% of Predsevug is mismanaged (uncollected, evidence open burning and dumping); this is the post-consumer waste most likely to reach water ways. About 50% is landfilled, and 19% is incinerated. Recycling rate/public capacity number. Most of the world lacks the mechanical-recycling capacity needed to accommodate post-consumer ocean plastic, even where collection works.
Pew Charitable Trusts and SystemIQ estimated the impact of this in Breaking the Plastic Wave (2020): under a “system change” scenario of reduced supply, redesign, and an approximately twofold increase in mechanical recycling capacity, ocean plastic could be reduced ~80% by 2040. No one action alone can achieve that. A key determinant is the size of mechanical recycling capacity.
Tap-vs-Mop: where investment dollars actually move the needle
A decision matrix, below, compares the share of the total annual ocean-plastic flow that various interventions can affect, from smallest to largest effect. Hard numbers, not “high/medium/low” cells.
| Intervention | Annual flow addressed | Capital intensity | Role |
|---|---|---|---|
| Volunteer beach & river cleanups | <0.1% | Low (volunteer-funded) | Symbolic, microplastic education, local biodiversity |
| Open-ocean cleanup systems (e.g., System 03) | ~0.5% of legacy stock per system-year (publicly stated) | High (vessel + offshore infra) | Recovery of legacy gyre plastic |
| River-mouth interception (e.g., Interceptors) | ~1–3% of flow per high-leakage river-year | Mid (per unit, fixed install) | Tap-side prevention at chokepoints |
| Mechanical recycling capacity buildout | 30–60% of land-based flow if scaled per Pew/SystemIQ pathway | Mid-to-high (industrial CapEx) | Tap-side prevention, economic absorption of waste |
| Source reduction & redesign (policy) | Highest theoretical ceiling | Regulatory | Long-horizon, slowest to deploy |
What industrial recycling actually requires
Mechanical plastic recycling involves four stages: (1.) polymer separation (PET can be distinguished from HDPE, PP, PVC, etc), (2.) shredding to a uniform (10-50 mm) flake, (3.) washing (hot caustic for PET bottle streams; friction washing for film) to remove food, labels, adhesive, etc, and (4.) pelletizing (hot melt filtration) into a market-ready granule.
All steps will have design decisions that impact the acceptability of the output for sale. PET bottles require float-sink separation tanks (because PET sinks, PE/PP caps float – for the physics that strands HDPE caps in the GPGP separates them on a recycling line). PE film will not make it through a hot caustic wash for PET; it needs friction washing and densification. Mixed rigid plastics require multi-stage washing. One line perfectly optimized for one feedstock will not work well with another.
This is the reality of recycling capacity in practice: it is polymer-specific lines designed for a specific waste stream and feedstock. Industrial plastic recycling equipment manufacturers such as Kitech provide dedicated designs, for example, PET bottle washing (500-3,000 kg/h, hot caustic + float-sink), PE film washing (300-1,000 kg/h, friction wash + densification), and agricultural film recycling (300-1,000 kg/h, contamination removal). At the end of every line is a pelletizing system with 80-120 mesh melt filtration, producing pellets which are <3% moisture for downstream injection or extrusion.
Available technology is ready. What remains is deployment in the geographies that produce the majority of the leakage – Southeast Asia, certain regions of South Asia and Africa – where collection infrastructure is improving faster than processing infrastructure. A Frontiers in marine Science 2025 review of mechanical recycling and upcycling made the same argument in academic language: technology generally is not the near-term challenge; siting of capacity and economics of feedstock are.
📐 Polymer fractions that move the needle
PET (bottles), HDPE (caps, drums, milk jugs) and PP (caps, woven bags, household goods) are three polymer streams with established recycling markets and commercially-practical mechanical-recycling economics. Conjugated they encompass the majority of high-volume packaging streams that drive municipal-waste leakage. Films (LDPE, LLDPE) are technically recyclable but less economically, while agricultural film and woven PP are emerging streams of collection in high-agricultural economies.
Policy, Treaty, and Corporate Accountability

Three policy mechanisms are framing the coming five years of ocean-plastic action: a stalled UN treaty, an enforcable regional rulebook in the EU, and a slow yet steady wave of producer-responsibility legislation at the national and US-state level.
UN Global Plastics Treaty — INC-5.2 ended without consensus
In March 2022, 175 countries at UNEA-5.2 adopted the resolution “End plastic pollution: towards an international legally binding instrument” – kicking off negotiations for what has been termed a Paris-Agreement-like-pact for plastic. Five rounds of negotiations were envisaged. A fifth round (INC-5) at Busan in South Korea, concluded prematurely in late-2024 without consensus. A renewed round, INC-5.2, scheduled to convene in Geneva from August 5 to 15, 2025, was expected to conclude the negotiations. It too, did not reach a consensus, primarily over whether the treaty should limit virgin-plastic production or be largely focused on downstream waste management.
Political implications for corporates planning for covenant implementation are clear: a legally-binding global stockpile will not be delivered in the near-term. Voluntary business initiatives and regionally-enforceable regulation should take their place, with the inevitable unevenness that entails.
EU Single-Use Plastics Directive and EPR schemes
EU’s Directive (EU) 2019/904 on single-use plastics is almost fully implemented across member states; banning a defined list (cotton-bud sticks, cutlery, plates, straws, stirrers, balloon sticks, expanded-polystyrene food & drink containers) & extending producer-responsibility (EPR) on packaging, fishing gear and tobacco filters. EPR-style laws – the polluter-pays model whereby producers pay the costs of collection & reprocessing of packaging & other products after use – are in effect or coming to the US in Maine, Oregon, Colorado, California, Minnesota & other states, and in Canada, Australia & Latin American countries.
Branded waste audits
Annual brand audits run by of the Break Free From plastic coalition, undertaken by citizen-volunteers in over 80 countries, show a very small number of big FMCG companies as the most commonly sampled brands in cleanup litter. The audits are NGO-initiated & methodologically limited, but the directional message — that a relatively small number of firms’ packaging choices account for a large share of the detectable branded litter — has held steady across multiple rounds.
Outlook 2026–2030 — Recycling Capacity, the Treaty, and Where the Gaps Are
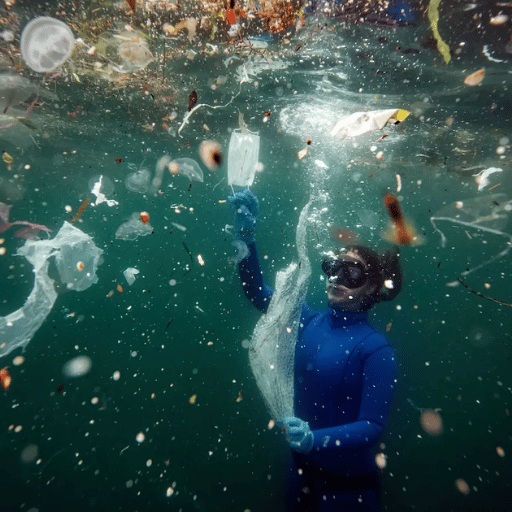
3+1 futures shapes the next five years.
Plastic waste is on track to roughly double by 2060 in business-as-usual
The BAU scenario developed by the Organization for Economic Cooperation & Development’s (OECD) models consumer plastics utilising the “business as usual” approach – finding that volumetrically global plastic waste doubles by 2060, with the fastest growth in provinces outside of the OECD. To this forecast Borrelle et al. (2020) pair a projection – 20-53 million tonnes a year dumped into aquatic systems by 2030 even with an aggressive management scenario – a finding which means that absent a dramatic technology shift, existing trends will worsen. Progress.
Chemical-recycling debate will intensify
These trends have been co-opted by the plastics industry into a false rationalisation for chemical recycling – pyrolysis & gasification of mixed plastic into fuel or other products – positioned by industry as an addition to mechanical processes. This false subsidy of chemical over mechanical pathways has been countered by NGO advocacy, including the publication of the Breaking Down Chemical Recycling fact sheet by the ocean Conservancy in January 2025, & the 2025 Frontiers in Marine Science review, which found that for marine & consumer-level plastic, current accounting of the life-cycle show that mechanical pathways outstrip chemical pathways on both lifecycle emissions & on economics. Expect to see this argument surface in every EPR funding decisionmaker over the coming months.
Regional capacity gaps will determine outcomes
The four biggest countries account for three-quarters of riverine plastic emissions to the ocean. Three of these countries – the Philippines, Indonesia & Malaysia – are in the same areas where expanding infrastructure to process waste mechanically will have the biggest marginal effectiveness on ocean leakage. A most important question of the next decade is where new capacity should be sited – in the developing countries where marginal effectiveness is maximised, or in the high-income countries where low-cost shipping under-priced for reprocessing will remain an incentive to continue exporting expensive-to-recycle waste. Since China’s 2018 ban on plastics exports, trade continues at the (top-down) rate of roughly 3.2 tonnes/year – about 1% of all plastic waste. Highest-influx areas in each of the 4 biggest recipient countries, though, both received (bottom-up) steadily increasing shipments through the 2010-2015 period, with the largest piece arriving in 2014.
Action items by audience
- ✔
Brands & packaging procurement: set polymer-specific recycled-content targets (e.g., 30% rPET by 2027), and verify the upstream supply has audited mechanical-recycling provenance — not paper credits. - ✔
Recycling-business operators: evaluate where capacity demand is rising fastest (high-leakage middle-income regions) and where pellet pricing relative to virgin resin supports a 36-month payback, given current market conditions. - ✔
Policymakers: US-state and provincial EPR provides the only near-term regulatory lever in the absence of a UN treaty; pair with collection-infrastructure funding to avoid creating obligations without capacity. - ✔
Equipment buyers: match line configuration to actual feedstock — a PET bottle line cannot run film, and vice versa. Line selection drives output quality, payback, and ESG defensibility of any “recycled-content” claim downstream. - ✔
Consumers: reduce plastic where the marginal effort is low (reusable bottle, refusing single-use plastic bags at checkout, avoiding microbead products) — recognising that personal action is necessary but not the swing factor. A swing factor: recycling capacity built where the leak is.
Frequently Asked Questions
Q: What is the largest source of plastic in the ocean?
View Answer
Widely dispersed mismanaged municipal plastic waste in coastlines of middle-income developing countries has dominated sources – about 80% of ocean plastic originates on land, mainly via rivers. Philippines, India, China & Indonesia together alone are responsible for roughly 70% of the riverine plastic emissions. In the Great Pacific Garbage Patch alone, though, the most common transportation means of hard-plastic is fishing.
Q: How much plastic enters the ocean each year?
View Answer
Most peer-reviewed published work (OECD 2022, Our World in Data 2023) since estimates the yearly entrance of ocean in the following range: 1-2 Mt. A figure of 8 million tonnes is well known, has a history, and we are grateful to Jambeck et al. 2015 for proposing it. It has been widely refined since. Estimates of figure entering all aquatic ecosystems (rivers, lakes, ocean combined) appear in the range of 19-23 million tonnes Borrelle et al. 2020 – but that is only some fraction of the amount that reaches the open ocean.
Q: What are 5 facts about plastic pollution in the ocean?
View Answer
1.—Annual ocean inflow is about 1-2 Mt enter the ocean – about 0.5% of global plastic waste. 2.—Five subtropical gyres concentrate floating plastic, with the single GPGP holding about 1.8 trillion pieces. 3.—80% of GPGP hard-plastic mass: abandoned fishing gear. 4.—Over 1000 rivers carry 80% of land-based inputs to the ocean. 5.—Microplastic detected in human blood, lungs, placenta, and breastmilk; long-term human health consequences under investigation.
Q: Are microplastics in seafood harmful to humans?
View Answer
Microplastic are contaminating most commercially important marine catches and has been detected in human tissues, although firm causality between human consumption of microplastic, and individual human disease, does not yet exist. Current most-exposure comes from other sources: drinking water, dust, packaging foodstuffs. Pale scientifika at 2026: presence confirmed, long-term consequence unproven.
Q: Can ocean plastic actually be recycled?
View Answer
Most plastic retrieved along ocean beaches and in shallow waters has been mechanochemically recycled, though with limits. Longer-term severe degradation in saltwater, UV irradiation, anthropogenic contamination, will reduce the quality and value of ocean-hatched pellets compared with postconsumer waste. Small companies are establishing a niche market for endangered-i species “ocean-bound” pellet pelts at a premium – a far less attractive and profitable business option compared with preventing plastic emission in the first place by investing in high-leakage areas of the planet in mechanical recycling.
Q: What does industrial recycling do that beach cleanups can’t?
View Answer
Beach cleanups disposes of only a tiny fraction of the annual flow, capturing ocean already in a state of degradation. Large-scale mechanical recycling that involves separating, shredder, washing, and pellet formicarion from the point of catch up to 60% of upstream emissions when driven by POP at the Pew/SystemIQ pathway. cleanups and recycling should be seen as part of a spectrum, with theformer targeting legacy plastic and influencing consumer choice, the latter tending the upstream tap.
is designing a mechanical-recycling line for PET, PE, PP, or agricultural film?
Capacity siting and feedstock match-up determines whether a line economically displaces virgin serin – or remains idle. Configuration matters more than equipment list price.
About This Analysis
This Guide is assembled from peer-reviewed published literature and the OECD’s global plastics Outlook 2022 not advocacy material. Where powers-that-be have glorified figure (the “8 Mt/yr” headline, the “10 rivers / 90%” claim), and newer research has superceded the figural narrative (referring to the source in footnotne), we do likewise. Recycling-equipment view of the “Recycling Response” section is based on Kitech’s manufacturing experience delivering hundreds of industrial PET, PE, PP, and film recycling lines to providers operating in over 80 nations – the geography of most leak.
References & Sources
- OECD Global Plastics Outlook 2022 — Organisation for Economic Co-operation and Development
- Plastic Pollution (Ritchie, Samborska & Roser, 2023) — Our World in Data, University of Oxford
- Borrelle et al. 2020 — Predicted growth in plastic waste exceeds efforts to mitigate plastic pollution — Science
- Meijer et al. 2021 — More than 1000 rivers account for 80% of global riverine plastic emissions — Science Advances
- Lebreton et al. 2018 — Evidence that the Great Pacific Garbage Patch is rapidly accumulating plastic — Scientific Reports
- Leslie et al. 2022 — Discovery and quantification of plastic particle pollution in human blood — Environment International
- NOAA Marine Debris Program — A Guide to Plastic in the Ocean — National Oceanic and Atmospheric Administration, U.S. Department of Commerce
- INC-5.2 Resumed Session — United Nations Environment Programme
- INC-5.2 Summary Report (Geneva, 5–15 August 2025) — Earth Negotiations Bulletin / IISD
- Directive (EU) 2019/904 on the reduction of the impact of certain plastic products on the environment — European Union
- Breaking the Plastic Wave (2020) — Pew Charitable Trusts & SystemIQ
- Mechanical recycling and upcycling of marine macro- and microplastics (2025) — Frontiers in Marine Science
- Breaking Down Chemical Recycling (January 2025) — Ocean Conservancy
- Primary Microplastics in the Oceans (2017) — International Union for Conservation of Nature (IUCN)
- Kühn & van Franeker 2020 — Quantitative overview of marine debris ingested by marine megafauna — Marine Pollution Bulletin
Related Articles
- What Is Recycling? Definition, Process, Types & Benefits — Foundational concept and recycling category structure
- Plastic Recycling Machine: Types, Selection & Cost Guide — Equipment-side detail for recycling-line buyers
- Biodegradable Plastic Guide: Types, Standards & Recycling Reality — Why bioplastics are not a substitute for mechanical recycling
- Post-Consumer Recycled Plastic: Economics & Quality — PCR market and pellet-quality benchmarks
- Agricultural Plastic Recycling — Mulch film, drip tape, and the agri-recovery stream
- PET Bottle Recycling Process — From baled bottles to food-grade pellets